


16,211
社区成员
 发帖
发帖 与我相关
与我相关 我的任务
我的任务
 分享
分享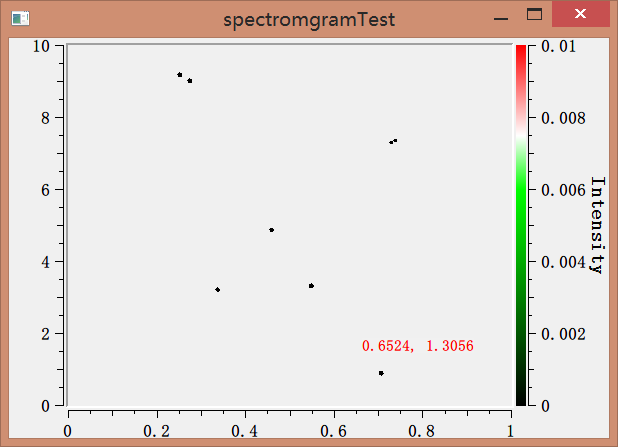
#include <qwt_plot.h>

#include <qwt_plot_spectrogram.h>


class Plot : public QwtPlot

{

    Q_OBJECT


public:


    Plot(QWidget * = NULL);


    public slots:


private:

    QwtPlotSpectrogram *d_spectrogram;

};
#include <qprinter.h>
#include <qprintdialog.h>
#include <qnumeric.h>
#include <qwt_color_map.h>
#include <qwt_plot_spectrogram.h>
#include <qwt_scale_widget.h>
#include <qwt_scale_draw.h>
#include <qwt_plot_zoomer.h>
#include <qwt_plot_panner.h>
#include <qwt_plot_layout.h>
#include <qwt_plot_renderer.h>
#include <qwt_matrix_raster_data.h>
#include "plot.h"
#include <QFile>
#include<QtAlgorithms>
class MyZoomer : public QwtPlotZoomer
{
public:
MyZoomer(QWidget *canvas) :
QwtPlotZoomer(canvas)
{
setTrackerMode(AlwaysOn);
}
virtual QwtText trackerTextF(const QPointF &pos) const
{
QColor bg(Qt::white);
//设置背景透明度
bg.setAlpha(20);
//QwtPlotZoomer::trackerTextF返回x,y的坐标轴的刻度数
QwtText text = QwtPlotZoomer::trackerTextF(pos);
text.setBackgroundBrush(QBrush(bg));
return text;
}
};
class SpectrogramData : public QwtMatrixRasterData
{
public:
SpectrogramData()
{
QFile data("H:/STUDY/Qtproject/spectromgramTest/est.bin");
if (data.open(QFile::ReadOnly))
{
QDataStream instream(&data);
QVector<double> rawData;
double *temp = new double[10000 * 300];
instream.readRawData((char*)temp, 10000 * 300 * sizeof(double));
for (int i = 0; i < 10000; i++)
{
for (int j = 0; j < 300; j++)
{
rawData += temp[j * 10000 + i];
}
}
setValueMatrix(rawData, 300);
delete[] temp;
}
setInterval(Qt::XAxis, QwtInterval(0, 1));
setInterval(Qt::YAxis, QwtInterval(0,10));
setInterval(Qt::ZAxis, QwtInterval(0.0, 0.01));
}
};
class LinearColorMapRGB : public QwtLinearColorMap
{
public:
LinearColorMapRGB() :
//首尾颜色
QwtLinearColorMap(Qt::darkCyan, Qt::red, QwtColorMap::RGB)
{
addColorStop(0.0, Qt::black);
addColorStop(0.6, Qt::green);
addColorStop(0.75, Qt::white);
}
};
Plot::Plot(QWidget *parent) :
QwtPlot(parent)
{
d_spectrogram = new QwtPlotSpectrogram();
// use system specific thread count
//设置线程数和缓存,影响不大
d_spectrogram->setRenderThreadCount(0);
d_spectrogram->setCachePolicy(QwtPlotRasterItem::PaintCache);
d_spectrogram->setData(new SpectrogramData());
d_spectrogram->attach(this);
//设置轮廓线的数量和层次(当值为多少时画一条轮廓线)
QList<double> contourLevels;
for ( double level =0.001; level <0.1; level += 0.002)
contourLevels += level;//不是相加,是在其后面添加元素
d_spectrogram->setContourLevels( contourLevels );
const QwtInterval zInterval = d_spectrogram->data()->interval(Qt::ZAxis);
// A color bar on the right axis
QwtScaleWidget *rightAxis = axisWidget(QwtPlot::yRight);
rightAxis->setTitle("Intensity");
//仅设置这个还不行
rightAxis->setColorBarEnabled(true);
setAxisScale(QwtPlot::yRight, zInterval.minValue(), zInterval.maxValue());
enableAxis(QwtPlot::yRight);//默认disabed
//设置画布对齐到所有坐标轴
plotLayout()->setAlignCanvasToScales(true);
//设置为RGBColorMap
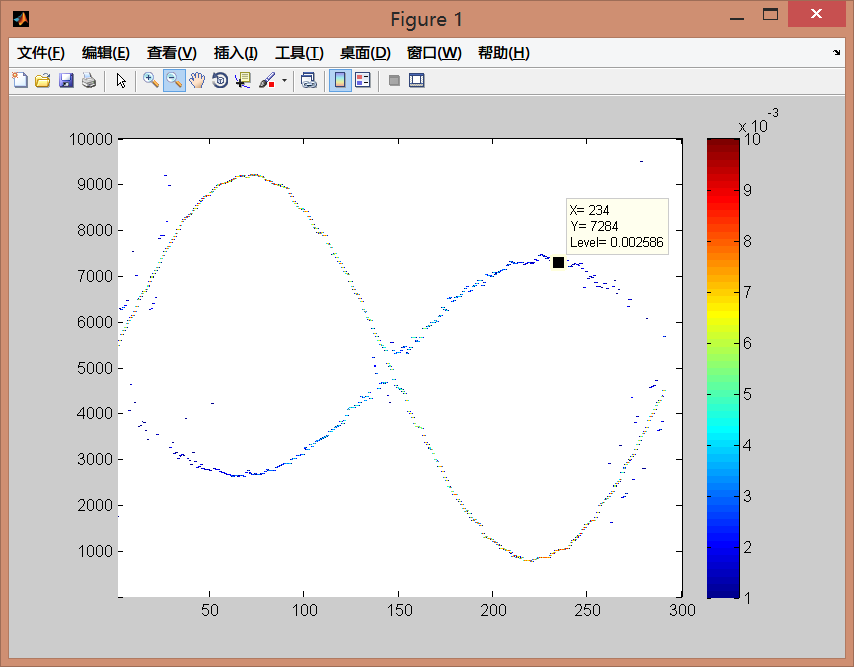
d_spectrogram->setColorMap(new LinearColorMapRGB());
rightAxis->setColorMap(zInterval, new LinearColorMapRGB());
//设置显示模式
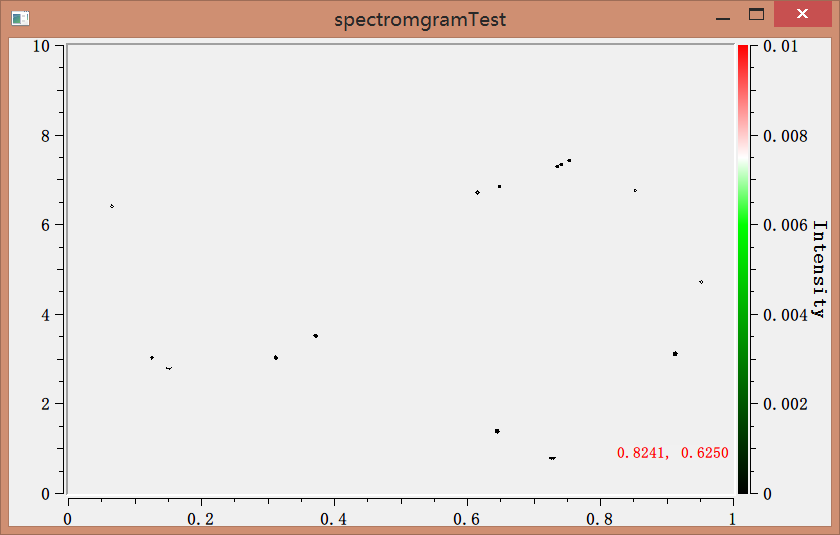
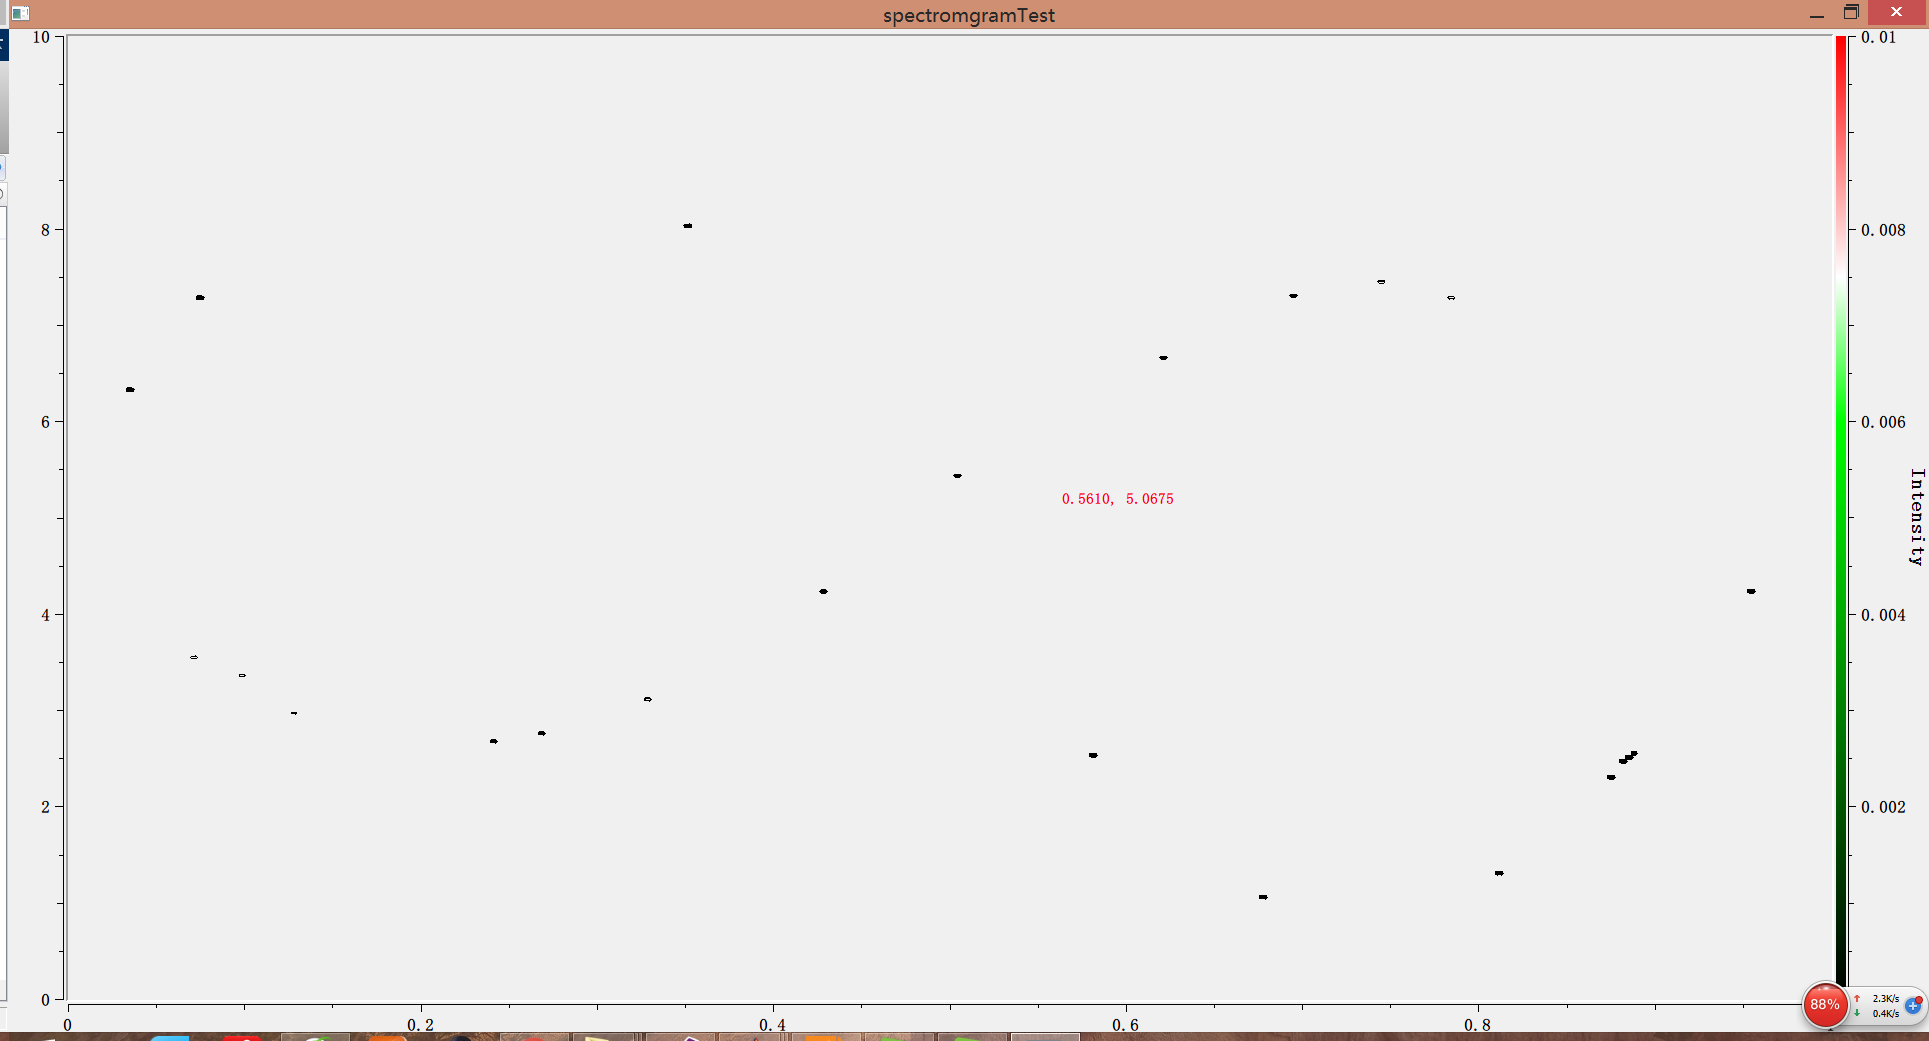
d_spectrogram->setDisplayMode(QwtPlotSpectrogram::ContourMode,true);
d_spectrogram->setDisplayMode( QwtPlotSpectrogram::ImageMode, false);
//设置鼠标操作
// LeftButton for the zooming
// MidButton for the panning
// RightButton: zoom out by 1
// Ctrl+RighButton: zoom out to full size
QwtPlotZoomer* zoomer = new MyZoomer(canvas());
//修改某一操作,比如一步返回到不放大状态
zoomer->setMousePattern(QwtEventPattern::MouseSelect2,
Qt::RightButton, Qt::ControlModifier);
zoomer->setMousePattern(QwtEventPattern::MouseSelect3,
Qt::RightButton);
const QColor c(Qt::red);
//设置RubberBandPen选择框笔触
zoomer->setRubberBandPen(c);
//设置TrackerPen笔触
zoomer->setTrackerPen(c);
QwtPlotPanner *panner = new QwtPlotPanner(canvas());
//移动绘图时候右边colorbar不需要自动改变刻度
panner->setAxisEnabled(QwtPlot::yRight, false);
panner->setMouseButton(Qt::MidButton);
// Avoid jumping when labels with more/less digits
// appear/disappear when scrolling vertically
const QFontMetrics fm(axisWidget(QwtPlot::yLeft)->font());
QwtScaleDraw *sd = axisScaleDraw(QwtPlot::yLeft);
sd->setMinimumExtent(fm.width("100.00"));
}


