社区
Android
帖子详情
关于visualize在targetsdkversion为23r的使用疑问
Lancer_Zhang
2016-09-26 07:00:59
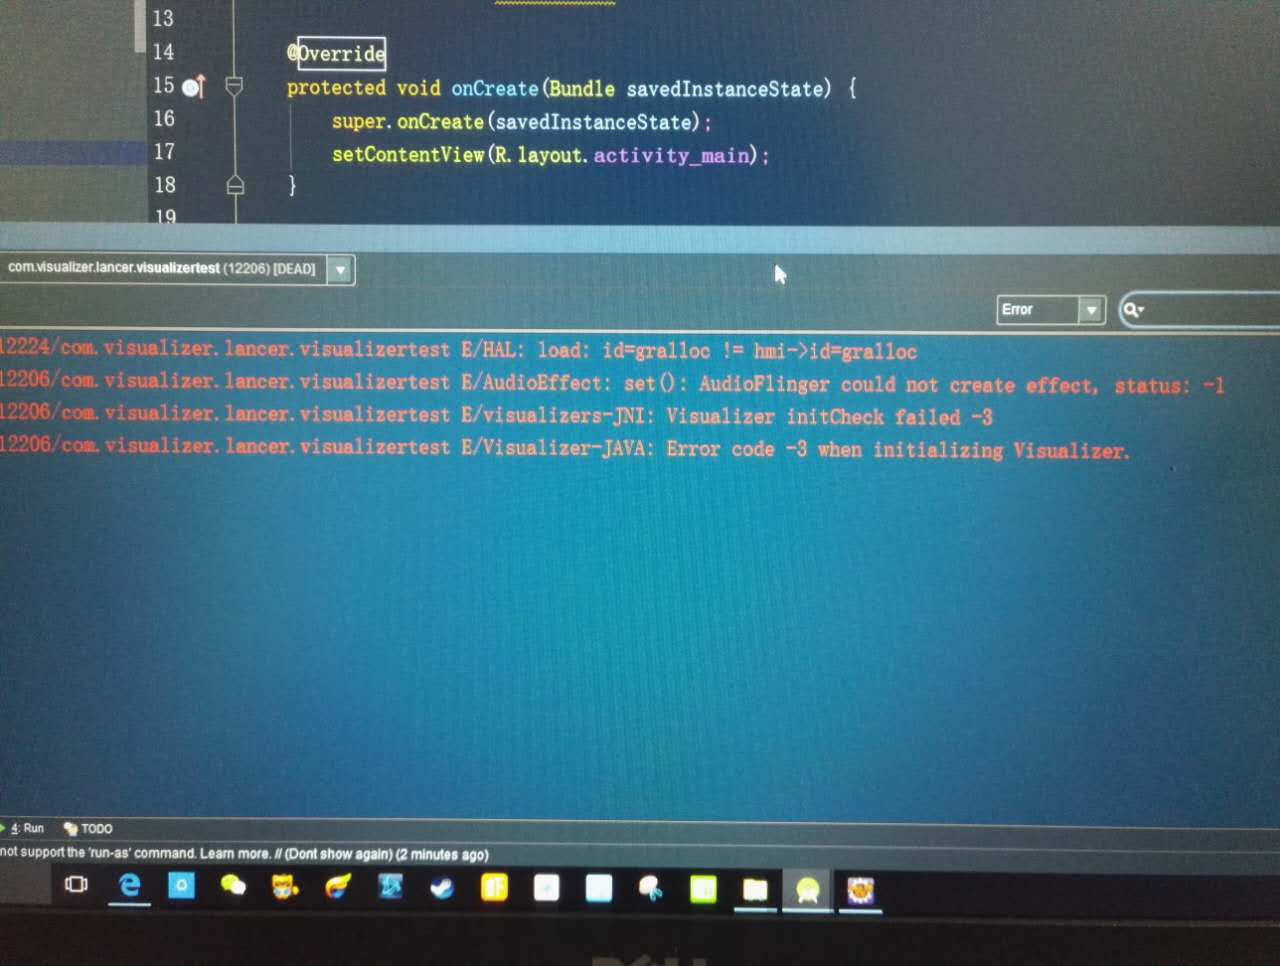
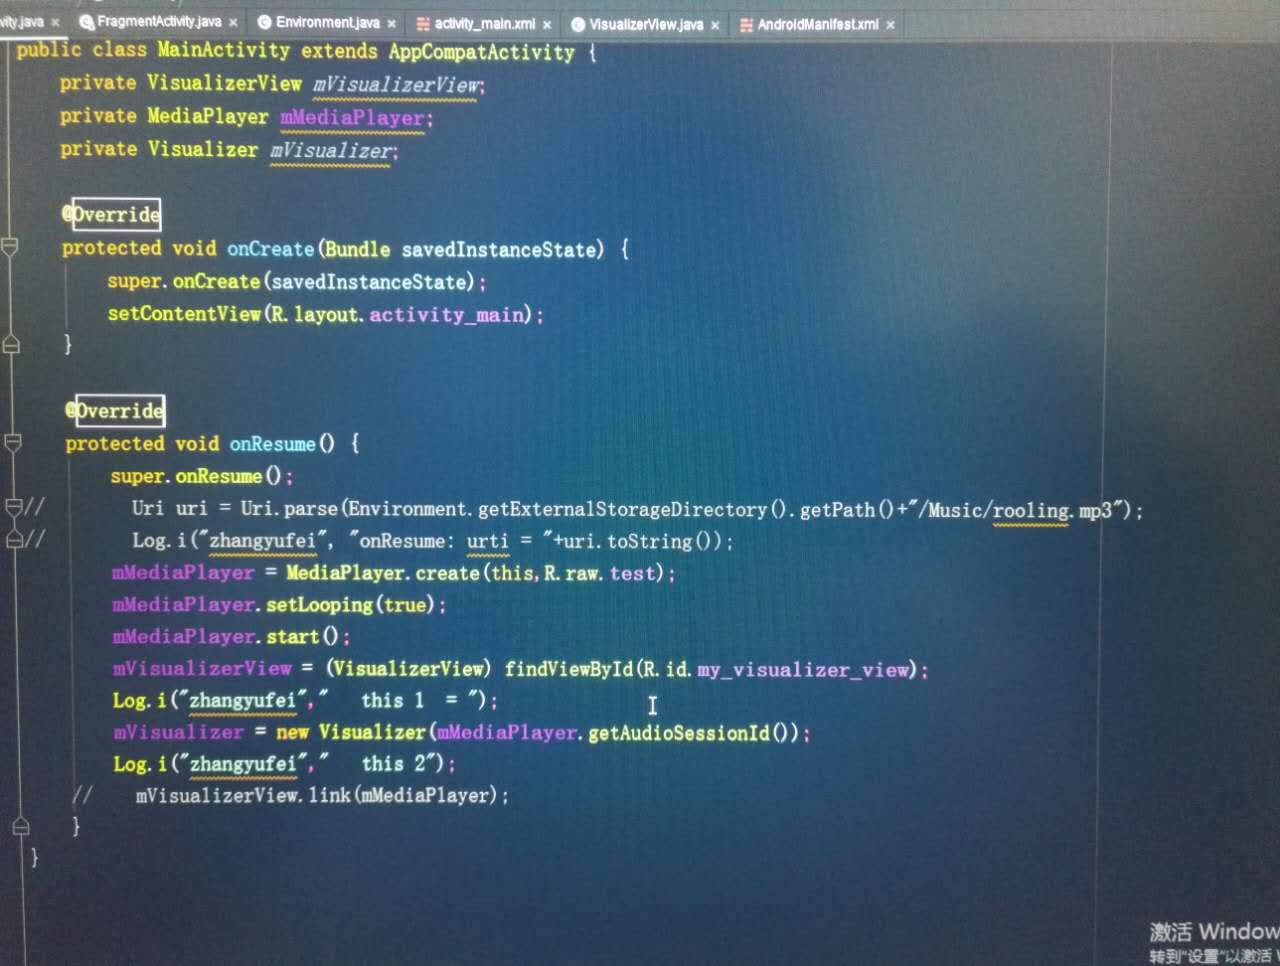
开发环境为targetsdkversion = 23 .我在 new 一个visualizer时(如图为自己写的几行小demo)
会从底层报出crash
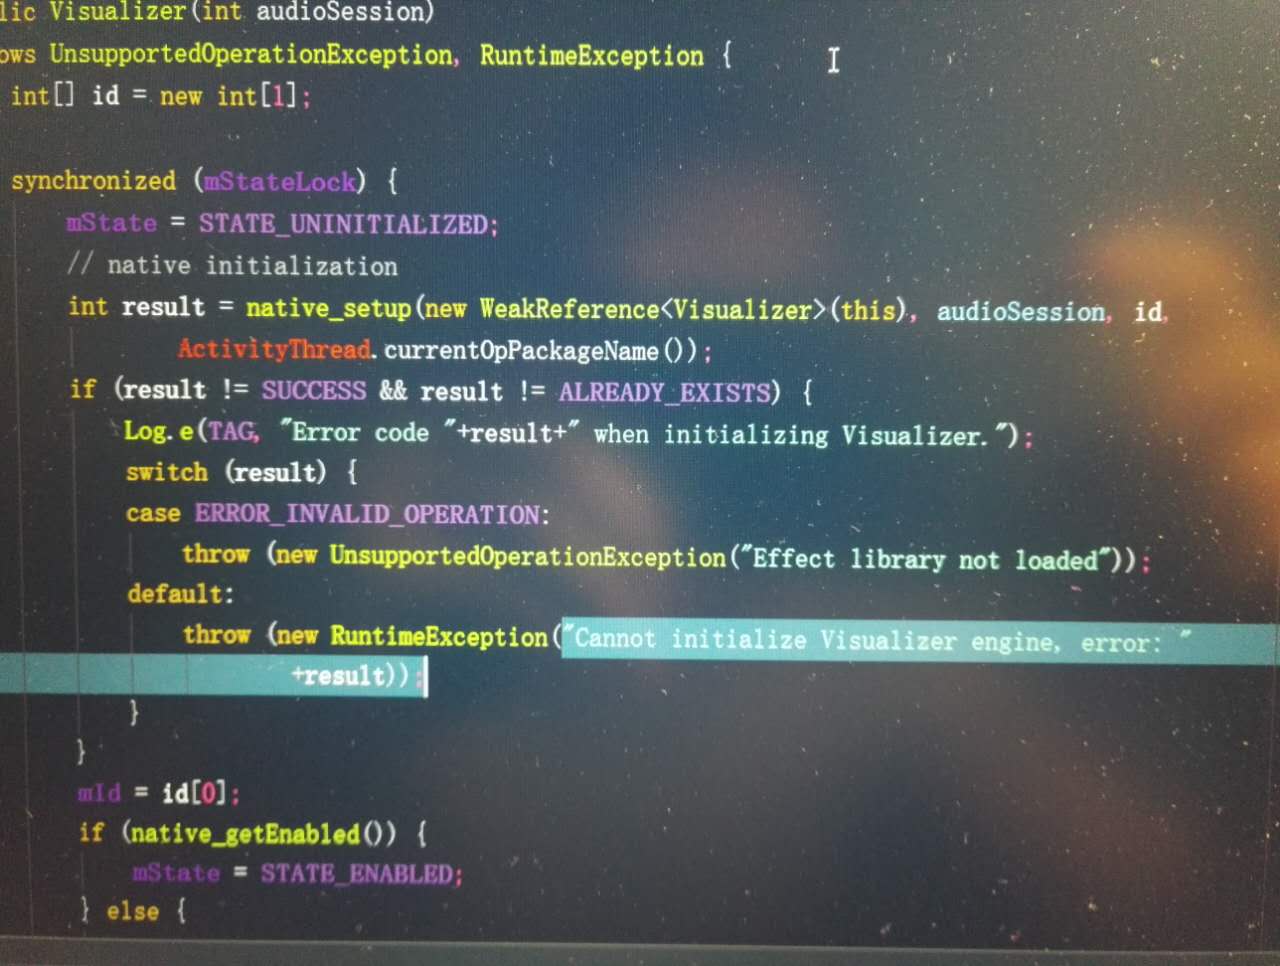
相关底层代码如下
然而我尝试在sdk为22以下时,就没有这样的问题,可以正常运行。
想请教各位大牛,如何解决这个在sdk = 23会crash的问题呀
...全文
152
1
打赏
收藏
关于visualize在targetsdkversion为23r的使用疑问
开发环境为targetsdkversion = 23 .我在 new 一个visualizer时(如图为自己写的几行小demo) 会从底层报出crash 相关底层代码如下 然而我尝试在sdk为22以下时,就没有这样的问题,可以正常运行。 想请教各位大牛,如何解决这个在sdk = 23会crash的问题呀
复制链接
扫一扫
分享
转发到动态
举报
写回复
配置赞助广告
用AI写文章
1 条
回复
切换为时间正序
请发表友善的回复…
发表回复
打赏红包
Lancer_Zhang
2016-09-26
打赏
举报
回复
不知道为什么图片显示不出,在这依次补上
visual
ize
.js
visual
ize
.js 对后缀名为dwg文件的预览。后端会把dwg文件转成vsf流,然后前端通过
visual
ize
.js进行预览。
PCL_
visual
ize
_cloud
PCL_
visual
ize
_cloud
Visual
ize
:一个jQuery可视化插件
数据可视化对于HTML来说,一直都是一个棘手的问题。Scott Jehl为我们准备了这样的一个插件-"
Visual
ize
",
使用
了HTML 5 Canvas。该插件提供了一个简单的$('table').
visual
ize
() 方法,从HTML table中生成bar, line, area以及pie charts,并且允许您
使用
各种不同的方式来配置。
R.for.Data.Science.
Visual
ize
.Model
What exactly is data science? With this book, you’ll gain a clear understanding of this discipline for discovering natural laws in the structure of data. Along the way, you’ll learn how to use the versatile R programming language for data analysis. Whenever you measure the same thing twice, you get two results—as long as you measure precisely enough. This phenomenon creates uncertainty and opportunity. Author Garrett Grolemund, Master Instructor at RStudio, shows you how data science can help you work with the uncertainty and capture the opportunities. You’ll learn about: Data Wrangling—how to manipulate datasets to reveal new information Data
Visual
ization—how to create graphs and other
visual
izations Exploratory Data Analysis—how to find evidence of relationships in your measurements Modelling—how to derive insights and predictions from your data Inference—how to avoid being fooled by data analyses that cannot provide foolproof results Through the course of the book, you’ll also learn about the statistical worldview, a way of seeing the world that permits understanding in the face of uncertainty, and simplicity in the face of complexity. Table of Contents Part I. Explore Chapter 1. Data
Visual
ization with ggplot2 Chapter 2. Workflow: Basics Chapter 3. Data Transformation with dplyr Chapter 4. Workflow: Scripts Chapter 5. Exploratory Data Analysis Chapter 6. Workflow: Projects Part II. Wrangle Chapter 7. Tibbles with tibble Chapter 8. Data Import with readr Chapter 9. Tidy Data with tidyr Chapter 10. Relational Data with dplyr Chapter 11. Strings with stringr Chapter 12. Factors with forcats Chapter 13. Dates and Times with lubridate Part III. Program Chapter 14. Pipes with magrittr Chapter 15. Functions Chapter 16. Vectors Chapter 17. Iteration with purrr Part IV. Model Chapter 18. Model Basics with modelr Chapter 19. Model Building Chapter 20. Many Models with purrr and broom Part V. Communicate Chapter 21. R Markdown Chapter 22. Graphics for Communication with ggplot2 Chapter 23. R Markdown Formats Chapter 24. R Markdown Workflow
R for Data Science: Import, Tidy, Transform,
Visual
ize
, and Model Data
R for Data Science: Import, Tidy, Transform,
Visual
ize
, and Model Data ISBN: 1491910399 | 2017 | True PDF | 522 pages | 32 MB What exactly is data science? With this book, you’ll gain a clear understanding of this discipline for discovering natural laws in the structure of data. Along the way, you’ll learn how to use the versatile R programming language for data analysis. Whenever you measure the same thing twice, you get two results—as long as you measure precisely enough. This phenomenon creates uncertainty and opportunity. Author Garrett Grolemund, Master Instructor at RStudio, shows you how data science can help you work with the uncertainty and capture the opportunities. You’ll learn about: Data Wrangling—how to manipulate datasets to reveal new information Data
Visual
ization—how to create graphs and other
visual
izations Exploratory Data Analysis—how to find evidence of relationships in your measurements Modelling—how to derive insights and predictions from your data Inference—how to avoid being fooled by data analyses that cannot provide foolproof results Through the course of the book, you’ll also learn about the statistical worldview, a way of seeing the world that permits understanding in the face of uncertainty, and simplicity in the face of complexity.
Android
80,351
社区成员
91,288
社区内容
发帖
与我相关
我的任务
Android
移动平台 Android
复制链接
扫一扫
分享
社区描述
移动平台 Android
android
android-studio
androidx
技术论坛(原bbs)
社区管理员
加入社区
获取链接或二维码
近7日
近30日
至今
加载中
查看更多榜单
社区公告
暂无公告
试试用AI创作助手写篇文章吧
+ 用AI写文章


 发帖
发帖 与我相关
与我相关 我的任务
我的任务
 分享
分享

 不知道为什么图片显示不出,在这依次补上


