echarts3设置不了饼形和漏斗的图标
 结帖人 2016-11-23 02:14:42
 myChart.setOption({
toolbox: {
show : true,
feature : {
mark : {show: true},
magicType : {
show: true,
type: ['pie', 'tiled']
},
restore : {show: true},
saveAsImage : {show: true}
}
},
series : [
{
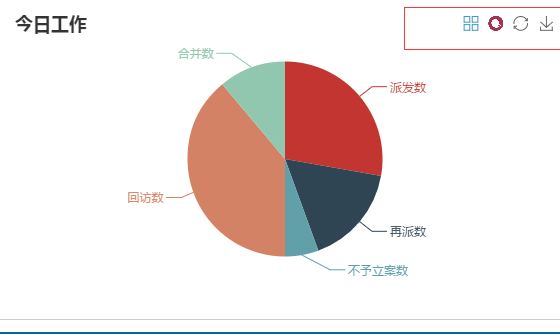
name:'今日工作',
type:'pie',
radius : '65%',
data:[
{value:workTodayCount.pfs, name:workTodayCount.pfsString},
{value:workTodayCount.zcpfs, name:workTodayCount.zcpfsString},
{value:workTodayCount.bylas, name:workTodayCount.bylasString},
{value:workTodayCount.hfs, name:workTodayCount.hfsString},
{value:workTodayCount.hbs, name:workTodayCount.hbsString}
]
}
]
});
这是个饼形图,图能出来,都没问题,就是右上角图标出不来,,我这里用的是Echarts3,我看了官方文档好像toolbox--feature --magicType--type 里只有'line'(切换为折线图), 'bar'(切换为柱状图), 'stack'(切换为堆叠模式), 'tiled'(切换为平铺模式),,echarts2却有,,大位大神指点一下迷津


 发帖
发帖 与我相关
与我相关 我的任务
我的任务
 分享
分享
