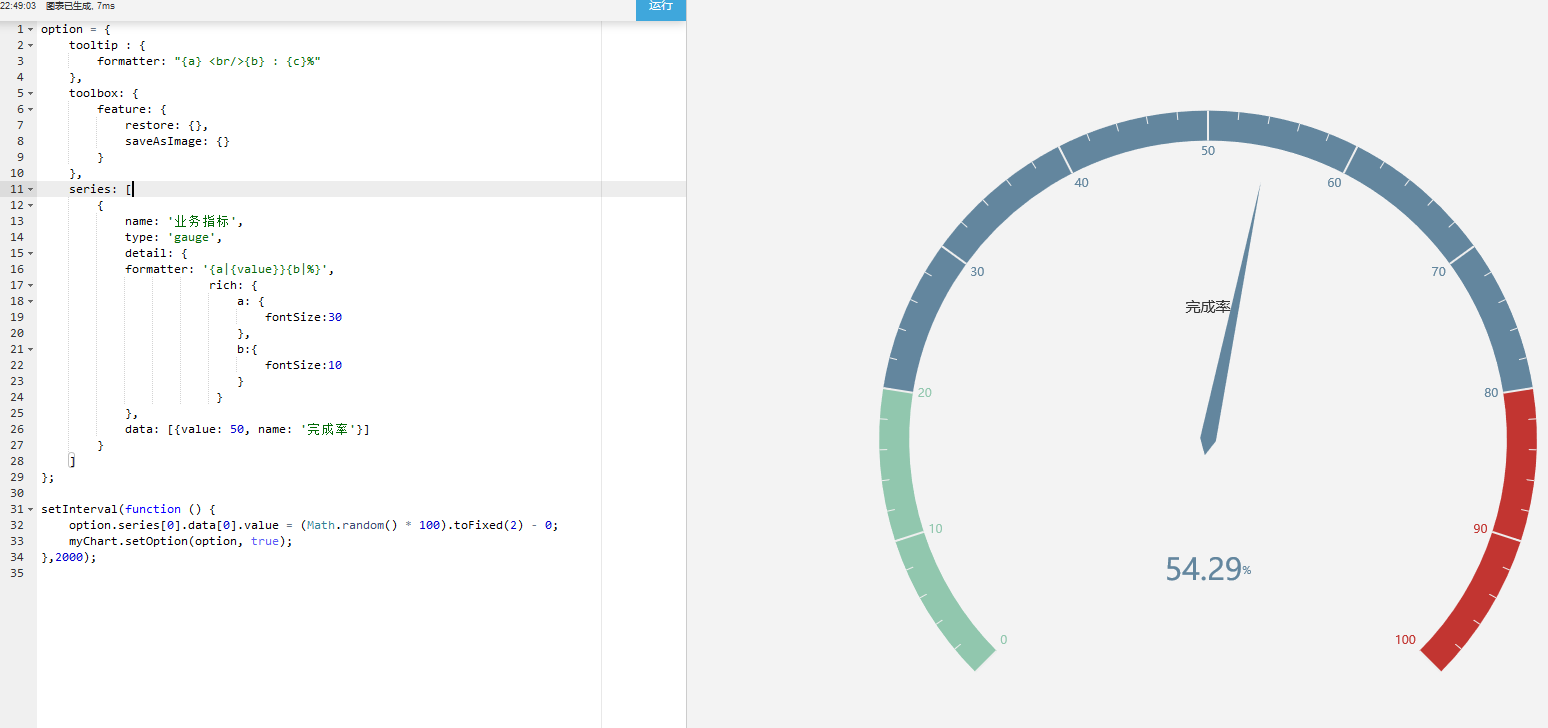
这是使用echarts实例自己写的,代码如下:这一段是可以实现富文本效果,显示值的字体大小和%的大小是不一样的
option = {
tooltip : {
formatter: "{a} <br/>{b} : {c}%"
},
toolbox: {
feature: {
restore: {},
saveAsImage: {}
}
},
series: [
{
name: '业务指标',
type: 'gauge',
detail: {
formatter: '{a|{value}}{b|%}',
rich: {
a: {
fontSize:30
},
b:{
fontSize:10
}
}
},
data: [{value: 50, name: '完成率'}]
}
]
};
setInterval(function () {
option.series[0].data[0].value = (Math.random() * 100).toFixed(2) - 0;
myChart.setOption(option, true);
},2000);
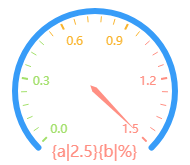
这一个是我自己写在js中的,结果是失效的,代码如下:
var option = {
series : [
{
name: title,
type: 'gauge',
radius: '100%',
min:"",
max:"",
endAngle:-45,
splitNumber:5,
axisLine: {
lineStyle: {
width: 0,
color: [[0.33, '#A3E06B'],[0.66, '#F9B530'],[1, '#ff8f83']],
}
},
axisTick: {
length:6,
lineStyle: {
color: 'auto'
}
},
axisLabel:{
formatter :function(params){
var temp = params.toFixed(1);
return temp;
},
textStyle: {
fontSize:_fontSize-4
}
},
splitLine: {
length:6,
lineStyle: {
color: 'auto'
}
},
pointer: {
width:3
},
detail: {
formatter: '{a|{value}}{b|%}',
rich: {
a: {
color: 'blue',
fontSize:30
},
b:{
fontSize:10
}
},
fontWeight: 'bolder',
textStyle:{
fontSize:_fontSize
},
offsetCenter :[0,'80%']
},
data:[{value:data}]
}
]
};


 发帖
发帖 与我相关
与我相关 我的任务
我的任务
 分享
分享
