37,743
社区成员
 发帖
发帖 与我相关
与我相关 我的任务
我的任务
 分享
分享

import datetime
import csv
import matplotlib.pyplot as plt
import matplotlib.finance as mpf
import matplotlib.dates as mpd
str2date =lambda x: mpd.date2num(datetime.datetime.strptime(x, '%m/%d/%Y').date())
data_text = """
date open high low close Volume
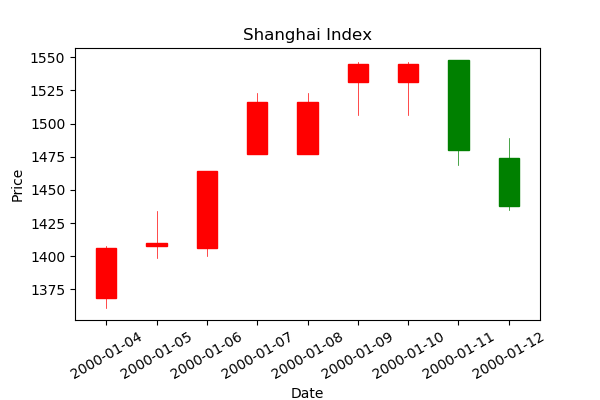
1/4/2000 1368.692993 1407.517944 1361.213989 1406.370972 0
1/5/2000 1407.828979 1433.780029 1398.322998 1409.682007 0
1/6/2000 1406.036011 1463.954956 1400.253052 1463.942017 0
1/7/2000 1477.154053 1522.824951 1477.154053 1516.604004 0
1/8/2000 1477.154053 1522.824951 1477.154053 1516.604004 0
1/9/2000 1531.712036 1546.723022 1506.404053 1545.112061 0
1/10/2000 1531.712036 1546.723022 1506.404053 1545.112061 0
1/11/2000 1547.677979 1547.708008 1468.756958 1479.781006 0
1/12/2000 1473.760986 1489.280029 1434.995972 1438.02002 0"""
data_list = list(csv.reader(data_text.strip().splitlines(), delimiter='\t'))
columns = data_list[0]
quotes = [[str2date(d[0])] + [float(v) for v in d[1:-1]] for d in data_list[1:]]
print(quotes)
fig,ax = plt.subplots(figsize=(6,4), facecolor=(0.5, 0.5, 0.5))
fig.subplots_adjust(bottom=0.2)
mpf.candlestick_ohlc(ax,quotes,width=0.4,colorup='r',colordown='g')
plt.grid(False)
ax.xaxis_date()
ax.autoscale_view()
plt.setp(plt.gca().get_xticklabels(), rotation=30)
plt.title("Shanghai Index")
plt.xlabel("Date")
plt.ylabel("Price")
plt.show()