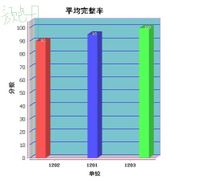
小弟用 jfreechart 插件 做了个柱状图,用来统计,可是图做出来还有些不尽人意的地方、上网查了好多资料,还是没能解决、请用过 jfreechart 的前辈们不吝赐教~感激不尽...
问题1:柱子的间距怎么控制、也就是图中的柱子和下标没能对齐,我分析原因就是柱子的间距太大了..但是调用了一些方法都不好使、
问题2:柱子的“Z”轴(就是图中标示的那条线)的颜色没能改变成蓝色。。。
问题3:如何让横轴和纵轴有箭头呢?->
现在就发现这两个问题、研究了好久,没有进展、希望大家帮忙..谢谢、
我的代码和截图如下:

JFreeChart chart = ChartFactory.createBarChart3D("平均完整率","单位","分数",dataset,PlotOrientation.VERTICAL,false,true,false);
chart.setTitle(new TextTitle("平均完整率",new Font("黑体",Font.BOLD,18)));
//获取图表区域对象
CategoryPlot plot=chart.getCategoryPlot();
//设置图表的背景颜色
plot.setBackgroundPaint(new Color(122,197,205));
//设置图表纵向网格线颜色
plot.setDomainGridlinePaint(Color.red);
plot.setDomainGridlineStroke(new BasicStroke());
//设置图表横向网格线颜色
plot.setRangeGridlinePaint(Color.blue);
plot.setRangeGridlineStroke(new BasicStroke());
//设置柱子透明度
plot.setForegroundAlpha(1.0f);
//获取x轴
CategoryAxis domainAxis=plot.getDomainAxis();
//设置x轴标题
domainAxis.setLabelFont(new Font("黑体",Font.BOLD,14));
//设置x轴字段
//x轴竖线颜色
domainAxis.setAxisLinePaint(Color.red);
domainAxis.setTickLabelFont(new Font("宋体",Font.BOLD,12));
//同理,y轴
ValueAxis rangeAxis=plot.getRangeAxis();
rangeAxis.setLabelFont(new Font("黑体",Font.BOLD,15));
//Y轴竖线颜色
rangeAxis.setAxisLinePaint(Color.red);
//处理中文乱码问题
//domainAxis.setUpperMargin(0.3);
//domainAxis.setLowerMargin(0.3);
domainAxis.setAxisLineVisible(true);
//拿到立体属性对象
BarRenderer3D renderer=new BarRenderer3D();
//图片背景色
plot.setOutlineVisible(true);
//图边框颜色
plot.setOutlinePaint(Color.magenta);
//设置墙颜色
renderer.setWallPaint(Color.LIGHT_GRAY);
renderer.setMaximumBarWidth(0.1);
renderer.setMinimumBarLength(0.1);
renderer.setItemMargin(0.001);
domainAxis.setCategoryMargin(0.0);//横轴标签之间的距离20%
chart.getRenderingHints().put(RenderingHints.KEY_TEXT_ANTIALIASING,RenderingHints.VALUE_TEXT_ANTIALIAS_OFF);
//让每个柱子上显示对应的value,并设置颜色
renderer.setItemLabelGenerator( new StandardCategoryItemLabelGenerator());
renderer.setItemLabelsVisible( true ); renderer.setItemLabelPaint(Color.white);
renderer.setBasePositiveItemLabelPosition(new ItemLabelPosition(ItemLabelAnchor.OUTSIDE12,TextAnchor.CENTER_LEFT));
//最后将此属性给plot
plot.setRenderer(renderer);
response.setCharacterEncoding("gbk");
response.setContentType("image/png");
ChartUtilities.writeChartAsPNG(myOut, chart, 100*i, 430);


 发帖
发帖 与我相关
与我相关 我的任务
我的任务
 分享
分享