4,816
社区成员
 发帖
发帖 与我相关
与我相关 我的任务
我的任务
 分享
分享private void Form4_Load(object sender, EventArgs e)
{
CreateChart(zedGraphControl1);
}
public void CreateChart(ZedGraphControl zgc)
{
GraphPane myPane = zgc.GraphPane;
// Set the titles and axis labels
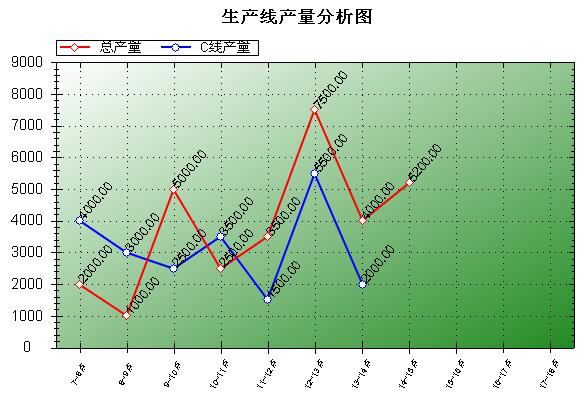
myPane.Title.Text = "生产线产量分析图";
//myPane.XAxis.Title.Text = "时间段";
//myPane.YAxis.Title.Text = "Pressure, Psia";
myPane.XAxis.Title.IsVisible = false;
myPane.YAxis.Title.IsVisible = false;
myPane.XAxis.MajorGrid.IsVisible = true; //珊格子
myPane.YAxis.MajorGrid.IsVisible = true;
string[] labels = { "7~8点", "8~9点", "9~10点", "10~11点", "11~12点", "12~13点", "13~14点","14~15点" ,"15~16点","16~17点","17~18点"};
double[] y = { 2000, 1000, 5000, 2500, 3500, 7500,4000,5200};
double[] x = { 4000, 3000, 2500, 3500, 1500, 5500, 2000};
// Hide the legend
myPane.Legend.IsVisible = true;
// Add a curve
LineItem curve = myPane.AddCurve("总产量", null,y, Color.Red, SymbolType.Diamond);
curve.Line.Width = 2.0F;
curve.Line.IsAntiAlias = true;
curve.Symbol.Fill = new Fill(Color.White);
curve.Symbol.Size = 7;
LineItem curve1 = myPane.AddCurve("C线产量", null, x, Color.Blue, SymbolType.Circle);
curve1.Line.Width = 2.0F;
curve1.Line.IsAntiAlias = true;
curve1.Symbol.Fill = new Fill(Color.White);
curve1.Symbol.Size = 7;
// Fill the axis background with a gradient
myPane.Chart.Fill = new Fill(Color.White, Color.FromArgb(255, Color.ForestGreen), 45.0F);
// Offset Y space between point and label
// NOTE: This offset is in Y scale units, so it depends on your actual data
const double offset = 1.0;
// Loop to add text labels to the points
for (int i = 0; i < y.Length; i++)
{
// Get the pointpair
PointPair pt = curve.Points[i];
// Create a text label from the Y data value
TextObj text = new TextObj(pt.Y.ToString("f2"), pt.X, pt.Y + offset,
CoordType.AxisXYScale, AlignH.Left, AlignV.Center);
text.ZOrder = ZOrder.A_InFront;
// Hide the border and the fill
text.FontSpec.Border.IsVisible = false;
text.FontSpec.Fill.IsVisible = false;
//text.FontSpec.Fill = new Fill( Color.FromArgb( 100, Color.White ) );
// Rotate the text to 90 degrees
text.FontSpec.Angle = 50; //字体倾斜度
myPane.GraphObjList.Add(text);
}
for (int i = 0; i < x.Length; i++)
{
// Get the pointpair
PointPair pt = curve1.Points[i];
// Create a text label from the Y data value
TextObj text = new TextObj(pt.Y.ToString("f2"), pt.X, pt.Y + offset,
CoordType.AxisXYScale, AlignH.Left, AlignV.Center);
text.ZOrder = ZOrder.A_InFront;
// Hide the border and the fill
text.FontSpec.Border.IsVisible = false;
text.FontSpec.Fill.IsVisible = false;
//text.FontSpec.Fill = new Fill( Color.FromArgb( 100, Color.White ) );
// Rotate the text to 90 degrees
text.FontSpec.Angle = 50; //数值字体倾斜度
myPane.GraphObjList.Add(text);
}
// Leave some extra space on top for the labels to fit within the chart rect
//myPane.YAxis.Scale.MaxGrace = 0.2;
myPane.XAxis.Type = AxisType.Text;
myPane.XAxis.Scale.TextLabels = labels;
myPane.XAxis.Scale.FontSpec.Size = 8; //x线字体
myPane.XAxis.Scale.FontSpec.Angle = 60;//x线字体倾斜度
// Calculate the Axis Scale Ranges
zgc.AxisChange();
}