

61,123
社区成员
 发帖
发帖 与我相关
与我相关 我的任务
我的任务
 分享
分享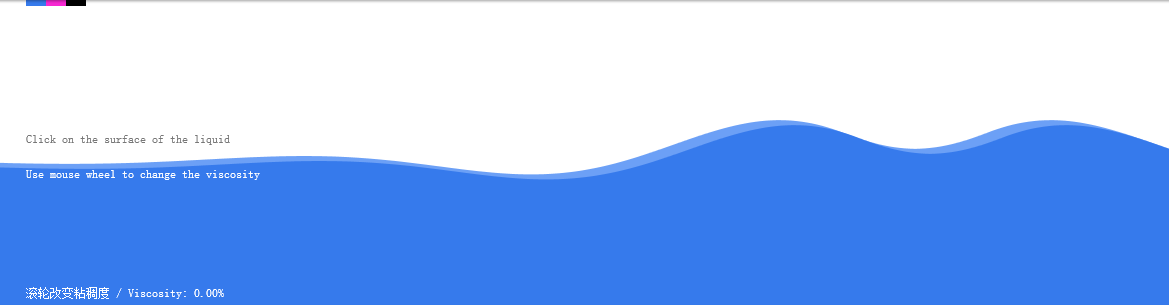


<html>
  <body>
  <div id='container'>
      <canvas id="canvas">
       啊哦,你的浏览器不支持canvas. Sorry~
      </canvas>
	  <span  id="blue" onclick="blue()"></span>
      <span id="purple" onclick="purple()"></span>
      <span id="black" onclick="black()"></span>
  </div>
  </body>
</html>
var canvas,ctx;
	var vertexes = [];
	var diffPt = [];var autoDiff = 1000;
	var verNum = 250;
	var canvasW = window.innerWidth+40;
	var addListener = function( e, str, func ) {
		if( e.addEventListener ) {
			e.addEventListener( str, func, false );
		}else if( e.attachEvent ) {
			e.attachEvent( "on" + str, func );
		}else {

		}
	};

	addListener( window, "load", init );

	function resize(){
		canvasW = document.getElementById('container').offsetWidth + 40;	initCanvas(canvasW,window.innerHeight);
			var cW = canvas.width;
			var cH = canvas.height;
			for(var i = 0;i < verNum;i++)
				vertexes[i] = new Vertex(cW / (verNum -1) * i , cH / 2,cH/2);
			initDiffPt();
		var win_3 = window.innerWidth/3;

	}
	function init(){
		resize();
		var FPS =30;
		var interval = 1000 / FPS >> 0;
		var timer = setInterval( update, interval );
		if ( window.addEventListener ) addListener( window, "DOMMouseScroll", wheelHandler );
		addListener( window, "mousewheel", wheelHandler );
		addListener(window,"resize",resize);

		canvas.onmousedown=function(e)
		{
				//div.innerHTML=e.clientX+":"+e.clientY;
				//var mx = document.getElementById("mx");

				//alert(1);
		var mouseX,mouseY;
				if (e) {
					mouseX = e.pageX;
					mouseY = e.pageY;
				}else {
				mouseX = event.x + document.body.scrollLeft;
				mouseY = event.y + document.body.scrollTop;
				}


				if(window.innerHeight/2 - mouseY < 50 && window.innerHeight/2 - mouseY> -50)
					//diffPt[150] = autoDiff;
					{
					autoDiff = 1000;
					if(mouseX<canvas.width-2){
						xx = 1 + Math.floor((verNum - 2) * mouseX / canvas.width);

						diffPt[xx] = autoDiff;
					}

					}
		}
	}

	var wheelHandler = function( e ) {
			var s = ( e.detail ) ? -e.detail : e.wheelDelta;
			s > 0 ? ( dd > 15 ? dd-- :  dd=dd) : ( dd < 50 ? dd++ : dd=dd );
	};

	function initDiffPt(){
		for(var i=0;i<verNum;i++)
		   diffPt[i]= 0;
	}
	var xx = 150;
	var dd = 15;

	function update(){
		//ctx.rect(50,20,280,620);
		//ctx.stroke();
		//ctx.clip();
		ctx.clearRect(0, 0, canvas.width, canvas.height);
		autoDiff -= autoDiff*0.9;
		diffPt[xx] = autoDiff;
		//左侧
		//差分,使得每个点都是上一个点的下一次的解,由于差分函数出来的解是一个曲线,且每次迭代后,曲线相加的结果形成了不断地波浪
			for(var i=xx-1;i>0;i--)
				{
				    var d = xx-i;
					if(d > dd)d=dd;
					diffPt[i] -= (diffPt[i]-diffPt[i+1])*(1-0.01*d);
				}
		//右侧
			for(var i=xx+1;i<verNum;i++)
				{
				    var d = i-xx;
					if(d > dd)d=dd;
					diffPt[i] -= (diffPt[i]-diffPt[i-1])*(1-0.01*d);
				}

		//更新点Y坐标
		for(var i = 0;i < vertexes.length;i++){
			vertexes[i].updateY(diffPt[i]);
		}

		draw();

	}
	var color1="#6ca0f6";
	var color2 = "#367aec";
	function draw(){
		ctx.beginPath();
		ctx.moveTo(0,window.innerHeight);
		ctx.fillStyle=color1;
		ctx.lineTo(vertexes[0].x,vertexes[0].y);
		for(var i = 1;i < vertexes.length;i++){
			ctx.lineTo(vertexes[i].x,vertexes[i].y);
		}
		ctx.lineTo(canvas.width,window.innerHeight);
		ctx.lineTo(0,window.innerHeight);
		ctx.fill();

		ctx.beginPath();
		ctx.moveTo(0,window.innerHeight);
		ctx.fillStyle=color2;
		ctx.lineTo(vertexes[0].x+15,vertexes[0].y+5);
		for(var i = 1;i < vertexes.length;i++){
			ctx.lineTo(vertexes[i].x+15,vertexes[i].y+5);
		}
		ctx.lineTo(canvas.width,window.innerHeight);
		ctx.lineTo(0,window.innerHeight);
		ctx.fill();

		ctx.fillStyle="#777";
		ctx.font="12px sans-serif";
		ctx.textBaseline="top";
		ctx.fillText("Click on the surface of the liquid",70,canvas.height/2-20);
		ctx.fillStyle="#fff";
		ctx.fillText("Use mouse wheel to change the viscosity",70,canvas.height/2+15);
		ctx.fillText("滚轮改变粘稠度 / Viscosity: "+((dd-15)*20/7).toFixed(2)+"%",70,canvas.height-20);
	}
	function initCanvas(width,height){
		canvas = document.getElementById("canvas");
		canvas.width = width;
		canvas.height = height;
		ctx = canvas.getContext("2d");
	}

	function Vertex(x,y,baseY){
		this.baseY = baseY;
		this.x = x;
		this.y = y;
		this.vy = 0;
		this.targetY = 0;
		this.friction = 0.15;
		this.deceleration = 0.95;
	}

	Vertex.prototype.updateY = function(diffVal){
		this.targetY = diffVal + this.baseY;
		this.vy += this.targetY - this.y
		this.y += this.vy * this.friction;
		this.vy *= this.deceleration;
	}
	var blue = function(){
		color1 = "#6ca0f6";
		color2 = "#367aec";
	}
	var black = function(){
		color1 = "#595959";
		color2 = "#000000";
	}

	var purple = function(){
		color1 = "#ff92ec";
		color2 = "#f727d2";
	}
html{
  overflow:hidden;
}
body{
   margin:0px;
}
canvas{
   margin-left:-40px;
}
span{
	 height:7px;
   width:20px;
	 display:inline-block;
	 cursor:pointer;
	 position:absolute;
	 top:0px;
	         transition: height 0.2s;
	      -o-transition: height 0.2s;
	    -moz-transition: height 0.2s;
	 -webkit-transition: height 0.2s;

}
span:hover{
	 height:12px;
}
#blue{
  background-color:#367aec;
  left:30px;
}
#purple{
  background-color:#f727d2;
  left:50px;
}
#black{
  background-color:#000000;
  left:70px;
}
#container{
  width:100%;

}


