

111,130
社区成员
 发帖
发帖 与我相关
与我相关 我的任务
我的任务
 分享
分享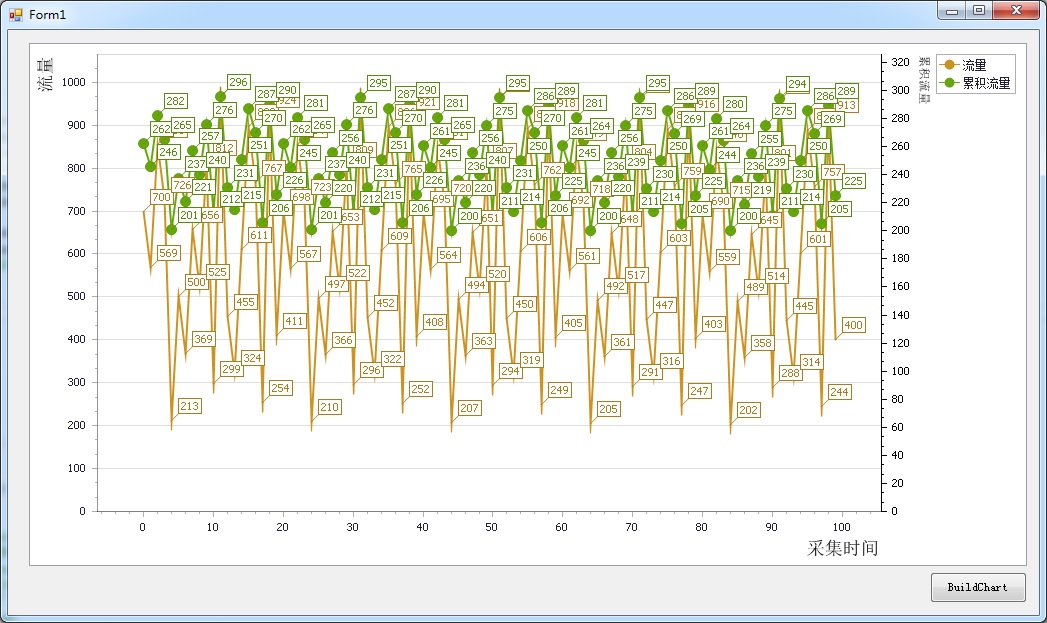

private void btnBuildChart_Click(object sender, EventArgs e)
{
int mValue = 0;
System.Data.DataTable mDTDisplacement = new System.Data.DataTable();
System.Data.DataTable mDTFlow = new System.Data.DataTable();
mDTDisplacement = new DataTable("FlowDisplacement");
DataColumn mDCDisplacementID = new DataColumn("ID", typeof(int));
mDTDisplacement.Columns.Add(mDCDisplacementID);
DataColumn mDCDisplacementTimes = new DataColumn("Times", typeof(int));
mDTDisplacement.Columns.Add(mDCDisplacementTimes);
DataColumn mDCDisplacementValue = new DataColumn("Value", typeof(int));//工资
mDTDisplacement.Columns.Add(mDCDisplacementValue);
mDTFlow = new DataTable("FlowDisplacement");
DataColumn mDCFlowID = new DataColumn("ID", typeof(int));
mDTFlow.Columns.Add(mDCFlowID);
DataColumn mDCFlowTimes = new DataColumn("Times", typeof(int));
mDTFlow.Columns.Add(mDCFlowTimes);
DataColumn mDCFlowValue = new DataColumn("Value", typeof(int));//工资
mDTFlow.Columns.Add(mDCFlowValue);
for (int i = 0; i < 100; i++)
{
System.Threading.Thread.Sleep(1);
Random mRDisplacement = new Random();
DataRow mDRDisplacement = mDTDisplacement.NewRow();
mValue = mRDisplacement.Next(200, 1000);
mDRDisplacement["ID"] = i;
mDRDisplacement["Times"] = i;
mDRDisplacement["Value"] = mValue;
mDTDisplacement.Rows.Add(mDRDisplacement);
Random mRFlow = new Random();
DataRow mDRFlow = mDTFlow.NewRow();
mValue = mRFlow.Next(200, 300);
mDRFlow["ID"] = i;
mDRFlow["Times"] = i;
mDRFlow["Value"] = mValue;
mDTFlow.Rows.Add(mDRFlow);
}
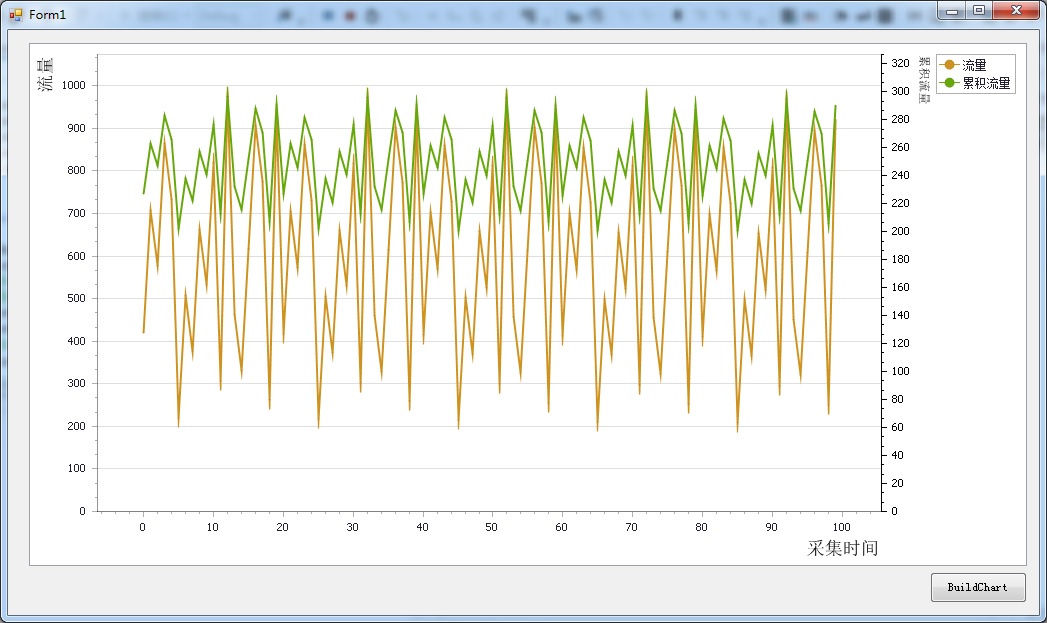
this.chartControl1.Series.Clear();
DevExpress.XtraCharts.Series mSDisplacement = new DevExpress.XtraCharts.Series("流量", DevExpress.XtraCharts.ViewType.Line);
mSDisplacement.ArgumentScaleType = DevExpress.XtraCharts.ScaleType.Numerical; //X轴的数据类型
//mSDisplacement.ArgumentScaleType = DevExpress.XtraCharts.ScaleType.Qualitative;//显示字符串的参数,必须设置类型为ScaleType.Qualitative
//((DevExpress.XtraCharts.PointSeriesView)mSDisplacement.View).PointMarkerOptions.Kind = DevExpress.XtraCharts.MarkerKind.Cross;
((DevExpress.XtraCharts.PointSeriesView)mSDisplacement.View).PointMarkerOptions.Size = 1; //改圆点到最小值,就不画圆了
((DevExpress.XtraCharts.PointSeriesView)mSDisplacement.View).Shadow.Visible = false;
//((DevExpress.XtraCharts.SeriesBase)mSDisplacement ).View.
mSDisplacement.Label.Visible = false;//去掉曲线区域的label显示
DevExpress.XtraCharts.Series mSFlow = new DevExpress.XtraCharts.Series("累积流量", DevExpress.XtraCharts.ViewType.Line);
mSFlow.ArgumentScaleType = DevExpress.XtraCharts.ScaleType.Numerical; //X轴的数据类型
//mSFlow.ArgumentScaleType = DevExpress.XtraCharts.ScaleType.Qualitative;//显示字符串的参数,必须设置类型为ScaleType.Qualitative
((DevExpress.XtraCharts.PointSeriesView)mSFlow.View).PointMarkerOptions.Size = 1; //改圆点到最小值,就不画圆了
((DevExpress.XtraCharts.PointSeriesView)mSFlow.View).Shadow.Visible = false;
mSFlow.Label.Visible = false;//去掉曲线区域的label显示
mSDisplacement.DataSource = mDTDisplacement;
mSFlow.DataSource = mDTFlow;
//X轴的数据字段
mSDisplacement.ArgumentDataMember = "Times";
mSFlow.ArgumentDataMember = "Times";
//Y轴的数据字段
mSDisplacement.ValueDataMembers[0] = "Value";
mSFlow.ValueDataMembers[0] = "Value";
this.chartControl1.Series.Add(mSDisplacement);
this.chartControl1.Series.Add(mSFlow);
//DevExpress.XtraCharts.SwiftPlotDiagram mSwiftPlotDiagram = (DevExpress.XtraCharts.SwiftPlotDiagram)chartControl1.Diagram;
//mSwiftPlotDiagram.AxisX.Title.Text = "采集时间";
//mSwiftPlotDiagram.AxisX.Title.Visible = true;
//mSwiftPlotDiagram.AxisX.Title.Alignment = System.Drawing.StringAlignment.Far;
//mSwiftPlotDiagram.AxisY.Title.Text = "流量";
//mSwiftPlotDiagram.AxisY.Title.Visible = true;
//mSwiftPlotDiagram.AxisY.Title.Alignment = System.Drawing.StringAlignment.Far;
//((DevExpress.XtraCharts.SwiftPlotDiagram)this.chartControl1.Diagram).SecondaryAxesY.Clear();
//DevExpress.XtraCharts.SwiftPlotDiagramSecondaryAxisY mFlowAxisY = new DevExpress.XtraCharts.SwiftPlotDiagramSecondaryAxisY(mSFlow.Name);
//((DevExpress.XtraCharts.SwiftPlotDiagram)this.chartControl1.Diagram).SecondaryAxesY.Add(mFlowAxisY);
////((DevExpress.XtraCharts.LineSeriesView)mSFlow.View).AxisY = mFlowAxisY;
//mFlowAxisY.Title.Text = mSFlow.Name;
//mFlowAxisY.Title.Visible = true;
//mFlowAxisY.Title.Alignment = System.Drawing.StringAlignment.Far;
//DevExpress.XtraCharts.SwiftPlotDiagramSecondaryAxisY mDisplacementAxisY = new DevExpress.XtraCharts.SwiftPlotDiagramSecondaryAxisY(mSDisplacement.Name);
//((DevExpress.XtraCharts.SwiftPlotDiagram)this.chartControl1.Diagram).SecondaryAxesY.Add(mDisplacementAxisY);
////((DevExpress.XtraCharts.LineSeriesView)mSFlow.View).AxisY = mFlowAxisY;
//mDisplacementAxisY.Title.Text = mSDisplacement.Name;
//mDisplacementAxisY.Title.Visible = true;
//mDisplacementAxisY.Title.Alignment = System.Drawing.StringAlignment.Far;
DevExpress.XtraCharts.XYDiagram mDiagram = (DevExpress.XtraCharts.XYDiagram)chartControl1.Diagram;
mDiagram.AxisX.Title.Text = "采集时间";
mDiagram.AxisX.Title.TextColor = System.Drawing.Color.Black;
mDiagram.AxisX.Title.Visible = true;
mDiagram.AxisX.Title.Alignment = System.Drawing.StringAlignment.Far;
mDiagram.AxisY.Title.Text = "流量";
mDiagram.AxisY.Title.TextColor = System.Drawing.Color.Black;
mDiagram.AxisY.Title.Visible = true;
mDiagram.AxisY.Title.Alignment = System.Drawing.StringAlignment.Far;
CreateAxisY(mSFlow);
//CreateAxisY(mSDisplacement);
}
/// <summary>
/// 创建图表的第二坐标系
/// </summary>
/// <param name="series">Series对象</param>
/// <returns></returns>
private DevExpress.XtraCharts.SecondaryAxisY CreateAxisY(DevExpress.XtraCharts.Series series)
{
DevExpress.XtraCharts.SecondaryAxisY myAxis = new DevExpress.XtraCharts.SecondaryAxisY(series.Name);
((DevExpress.XtraCharts.XYDiagram)chartControl1.Diagram).SecondaryAxesY.Add(myAxis);
((DevExpress.XtraCharts.LineSeriesView)series.View).AxisY = myAxis;
myAxis.Title.Text = series.Name;
myAxis.Title.Alignment = StringAlignment.Far; //顶部对齐
myAxis.Title.Visible = true; //显示标题
myAxis.Title.Font = new Font("宋体", 9.0f);
//Color color = series.View.Color;//设置坐标的颜色和图表线条颜色一致
Color color = System.Drawing.Color.Black;
myAxis.Title.TextColor = color;
myAxis.Label.TextColor = color;
myAxis.Color = color;
return myAxis;
}

            DevExpress.XtraCharts.Series mSDisplacement = new DevExpress.XtraCharts.Series("流量", DevExpress.XtraCharts.ViewType.Line);
            mSDisplacement.ArgumentScaleType = DevExpress.XtraCharts.ScaleType.Numerical; //X轴的数据类型
            //mSDisplacement.ArgumentScaleType = DevExpress.XtraCharts.ScaleType.Qualitative;//显示字符串的参数,必须设置类型为ScaleType.Qualitative
            //((DevExpress.XtraCharts.PointSeriesView)mSDisplacement.View).PointMarkerOptions.Kind = DevExpress.XtraCharts.MarkerKind.Cross;
            ((DevExpress.XtraCharts.PointSeriesView)mSDisplacement.View).PointMarkerOptions.Size = 1;  //改圆点到最小值,就不画圆了
            ((DevExpress.XtraCharts.PointSeriesView)mSDisplacement.View).Shadow.Visible = false;
            //((DevExpress.XtraCharts.SeriesBase)mSDisplacement ).View.
            mSDisplacement.Label.Visible = false;//去掉曲线区域的label显示

            DevExpress.XtraCharts.Series mSFlow = new DevExpress.XtraCharts.Series("累积流量", DevExpress.XtraCharts.ViewType.Line);
            mSFlow.ArgumentScaleType = DevExpress.XtraCharts.ScaleType.Numerical; //X轴的数据类型
            //mSFlow.ArgumentScaleType = DevExpress.XtraCharts.ScaleType.Qualitative;//显示字符串的参数,必须设置类型为ScaleType.Qualitative
            ((DevExpress.XtraCharts.PointSeriesView)mSFlow.View).PointMarkerOptions.Size = 1;  //改圆点到最小值,就不画圆了
            ((DevExpress.XtraCharts.PointSeriesView)mSFlow.View).Shadow.Visible = false;
            mSFlow.Label.Visible = false;//去掉曲线区域的label显示

     DevExpress.XtraCharts.Series mSDisplacement = new DevExpress.XtraCharts.Series("流量", DevExpress.XtraCharts.ViewType.Line);
                mSDisplacement.Label.Visible = false;


