


111,129
社区成员
 发帖
发帖 与我相关
与我相关 我的任务
我的任务
 分享
分享


 [/quote]
一、
只要你有数据源,更新数据的时候把button1_Click中的代码替换就可以了.
你可以先用随机数试试效果
二、
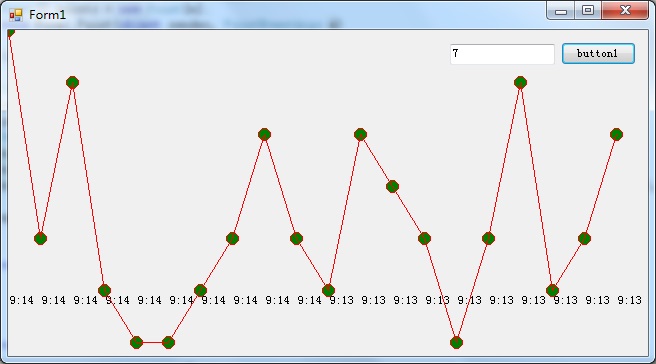
这段代码是在窗口中绘图.绘图大小使用窗口大小计算出的
points[i].X=this.Width/n*i;
points[i].Y=this.Height-dataPoint.V*this.Height/vMax;
你可以改进代码,用一个PictureBox代替窗口,将Form1_Paint事件过程邦定到PictureBox的Paint事件处理过程:选中PictureBox,在属性表上方选择事件,然后在Paint事件中创建处理过程。
然后,这段代码需要改造为:
points[i].X=PictureBox.Width/n*i;
points[i].Y=PictureBox.Height-dataPoint.V*PictureBox.Height/vMax;
三、
points[i].X=this.Width/n*i;
改为
points[i].X=this.Width-this.Width/n*i;
绘图的方向就变了。[/quote]
[/quote]
一、
只要你有数据源,更新数据的时候把button1_Click中的代码替换就可以了.
你可以先用随机数试试效果
二、
这段代码是在窗口中绘图.绘图大小使用窗口大小计算出的
points[i].X=this.Width/n*i;
points[i].Y=this.Height-dataPoint.V*this.Height/vMax;
你可以改进代码,用一个PictureBox代替窗口,将Form1_Paint事件过程邦定到PictureBox的Paint事件处理过程:选中PictureBox,在属性表上方选择事件,然后在Paint事件中创建处理过程。
然后,这段代码需要改造为:
points[i].X=PictureBox.Width/n*i;
points[i].Y=PictureBox.Height-dataPoint.V*PictureBox.Height/vMax;
三、
points[i].X=this.Width/n*i;
改为
points[i].X=this.Width-this.Width/n*i;
绘图的方向就变了。[/quote]
 谢谢~~~,最后一个问题,怎么改就能在picturebox中画两条线,横坐标都是时间,纵坐标分别来来自两个TextBox?
为什么TextBox中输入double型数的时候,好像画的不对。谢谢!
谢谢~~~,最后一个问题,怎么改就能在picturebox中画两条线,横坐标都是时间,纵坐标分别来来自两个TextBox?
为什么TextBox中输入double型数的时候,好像画的不对。谢谢! [/quote]
一、
只要你有数据源,更新数据的时候把button1_Click中的代码替换就可以了.
你可以先用随机数试试效果
二、
这段代码是在窗口中绘图.绘图大小使用窗口大小计算出的
points[i].X=this.Width/n*i;
points[i].Y=this.Height-dataPoint.V*this.Height/vMax;
你可以改进代码,用一个PictureBox代替窗口,将Form1_Paint事件过程邦定到PictureBox的Paint事件处理过程:选中PictureBox,在属性表上方选择事件,然后在Paint事件中创建处理过程。
然后,这段代码需要改造为:
points[i].X=PictureBox.Width/n*i;
points[i].Y=PictureBox.Height-dataPoint.V*PictureBox.Height/vMax;
三、
points[i].X=this.Width/n*i;
改为
points[i].X=this.Width-this.Width/n*i;
绘图的方向就变了。
[/quote]
一、
只要你有数据源,更新数据的时候把button1_Click中的代码替换就可以了.
你可以先用随机数试试效果
二、
这段代码是在窗口中绘图.绘图大小使用窗口大小计算出的
points[i].X=this.Width/n*i;
points[i].Y=this.Height-dataPoint.V*this.Height/vMax;
你可以改进代码,用一个PictureBox代替窗口,将Form1_Paint事件过程邦定到PictureBox的Paint事件处理过程:选中PictureBox,在属性表上方选择事件,然后在Paint事件中创建处理过程。
然后,这段代码需要改造为:
points[i].X=PictureBox.Width/n*i;
points[i].Y=PictureBox.Height-dataPoint.V*PictureBox.Height/vMax;
三、
points[i].X=this.Width/n*i;
改为
points[i].X=this.Width-this.Width/n*i;
绘图的方向就变了。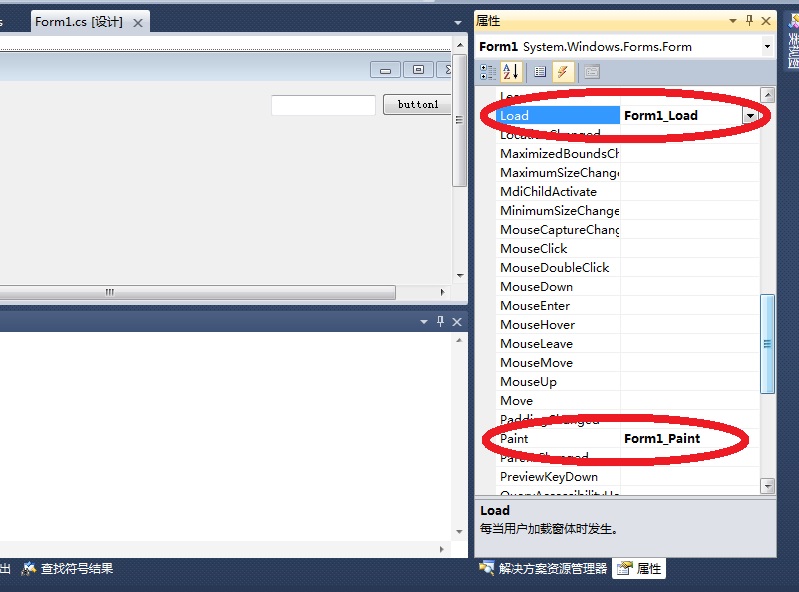

 public Form1()
{
InitializeComponent();
}
/// <summary>
/// 数据点结构
/// </summary>
struct DataPoint
{
public int V;
public DateTime T;
}
private const int n = 20;//点数
private int vMax = 1;//最大值
private const int r = 6;//点半径
private DataPoint[] data = new DataPoint[n];//数据点
private Point[] points = new Point[n];//坐标点
/// <summary>
/// 添加数据
/// </summary>
/// <param name="sender"></param>
/// <param name="e"></param>
private void button1_Click(object sender, EventArgs e)
{
for (int i = 0; i < n - 1; i++)
{
data[n - i - 1] = data[n - i - 2];
}
data[0].T = DateTime.Now;
try
{
data[0].V = int.Parse(textBox1.Text);
}
catch
{
data[0].V = 0;
}
if (data[0].V > vMax)
{
vMax = data[0].V;//更新最大值
}
this.Refresh();//刷新,导致窗口重绘
}
//绘图函数
private void Form1_Paint(object sender, PaintEventArgs e)
{
for (int i=0; i < n; i++)
{
DataPoint dataPoint=data[i];
points[i].X=this.Width/n*i;
points[i].Y=this.Height-dataPoint.V*this.Height/vMax;
Rectangle rect = new Rectangle(points[i].X - r, points[i].Y - r, r + r, r + r);
e.Graphics.FillEllipse(new SolidBrush(Color.Green), rect);
e.Graphics.DrawEllipse(new Pen(Color.Red, 1), rect);
e.Graphics.DrawString(dataPoint.T.ToShortTimeString(), this.Font, new SolidBrush(Color.Black), points[i].X, this.Height -100);
}
e.Graphics.DrawLines(new Pen(Color.Red, 1), points);
}[/quote]
一、
只要你有数据源,更新数据的时候把button1_Click中的代码替换就可以了.
你可以先用随机数试试效果
二、
这段代码是在窗口中绘图.绘图大小使用窗口大小计算出的
points[i].X=this.Width/n*i;
points[i].Y=this.Height-dataPoint.V*this.Height/vMax;
你可以改进代码,用一个PictureBox代替窗口,将Form1_Paint事件过程邦定到PictureBox的Paint事件处理过程:选中PictureBox,在属性表上方选择事件,然后在Paint事件中创建处理过程。
然后,这段代码需要改造为:
points[i].X=PictureBox.Width/n*i;
points[i].Y=PictureBox.Height-dataPoint.V*PictureBox.Height/vMax;
三、
points[i].X=this.Width/n*i;
改为
points[i].X=this.Width-this.Width/n*i;
绘图的方向就变了。[/quote]
谢谢~~~,最后一个问题,怎么改就能在picturebox中画两条线,横坐标都是时间,纵坐标分别来来自两个TextBox?
为什么TextBox中输入double型数的时候,好像画的不对。谢谢![/quote]
谢谢~,我自己搞定了~~~
public Form1()
{
InitializeComponent();
}
/// <summary>
/// 数据点结构
/// </summary>
struct DataPoint
{
public int V;
public DateTime T;
}
private const int n = 20;//点数
private int vMax = 1;//最大值
private const int r = 6;//点半径
private DataPoint[] data = new DataPoint[n];//数据点
private Point[] points = new Point[n];//坐标点
/// <summary>
/// 添加数据
/// </summary>
/// <param name="sender"></param>
/// <param name="e"></param>
private void button1_Click(object sender, EventArgs e)
{
for (int i = 0; i < n - 1; i++)
{
data[n - i - 1] = data[n - i - 2];
}
data[0].T = DateTime.Now;
try
{
data[0].V = int.Parse(textBox1.Text);
}
catch
{
data[0].V = 0;
}
if (data[0].V > vMax)
{
vMax = data[0].V;//更新最大值
}
this.Refresh();//刷新,导致窗口重绘
}
//绘图函数
private void Form1_Paint(object sender, PaintEventArgs e)
{
for (int i=0; i < n; i++)
{
DataPoint dataPoint=data[i];
points[i].X=this.Width/n*i;
points[i].Y=this.Height-dataPoint.V*this.Height/vMax;
Rectangle rect = new Rectangle(points[i].X - r, points[i].Y - r, r + r, r + r);
e.Graphics.FillEllipse(new SolidBrush(Color.Green), rect);
e.Graphics.DrawEllipse(new Pen(Color.Red, 1), rect);
e.Graphics.DrawString(dataPoint.T.ToShortTimeString(), this.Font, new SolidBrush(Color.Black), points[i].X, this.Height -100);
}
e.Graphics.DrawLines(new Pen(Color.Red, 1), points);
}[/quote]
一、
只要你有数据源,更新数据的时候把button1_Click中的代码替换就可以了.
你可以先用随机数试试效果
二、
这段代码是在窗口中绘图.绘图大小使用窗口大小计算出的
points[i].X=this.Width/n*i;
points[i].Y=this.Height-dataPoint.V*this.Height/vMax;
你可以改进代码,用一个PictureBox代替窗口,将Form1_Paint事件过程邦定到PictureBox的Paint事件处理过程:选中PictureBox,在属性表上方选择事件,然后在Paint事件中创建处理过程。
然后,这段代码需要改造为:
points[i].X=PictureBox.Width/n*i;
points[i].Y=PictureBox.Height-dataPoint.V*PictureBox.Height/vMax;
三、
points[i].X=this.Width/n*i;
改为
points[i].X=this.Width-this.Width/n*i;
绘图的方向就变了。[/quote]
谢谢~~~,最后一个问题,怎么改就能在picturebox中画两条线,横坐标都是时间,纵坐标分别来来自两个TextBox?
为什么TextBox中输入double型数的时候,好像画的不对。谢谢![/quote]
谢谢~,我自己搞定了~~~

