


87,910
社区成员
 发帖
发帖 与我相关
与我相关 我的任务
我的任务
 分享
分享Ext.define('MyExtJS.model.ChartModel', {
extend : 'Ext.data.Model',
fields : [{
name : 'id',
mapping : 'id'
},
'options',
'countRate' ]
});var charStore= Ext.create('Ext.data.JsonStore',{
model : 'MyExtJS.model.ChartModel',
autoLoad: true,
proxy:{ <span></span>type:'ajax',
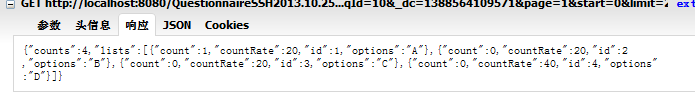
url:'system/analysis!queryAnalysisBySQId?sqId='+sqId, reader:{
type:'json',
root:'lists',
totalProperty : 'counts'
}
}
});var myChart = Ext.create('Ext.window.Window', {
title : '具体统计结果',
layout : 'fit',
autoShow : true,
width:600,
height:400,
items:[{
xtype : 'chart',
store : charStore,
animate : true,//是否启用动画效
legend : {
position : 'bottom' //图例位置
},
shadow : true,
series : [{
type : 'pie',//图表序列类型
field : 'countRate',//对应饼状图角度的字段名
showInLegend : true,//是否显示在图例当中
colorSet : ['#FFFF00','#669900','#FF6699','#66CCCC'],//颜色
label : {
field : 'options',//标签字段名
contrast : true,
color : '#FFFF00',
renderer : function(v){//自定义标签渲染函数
return "["+v+"]";
},
display : 'middle',//标签显现方式
font : '18px "Lucida Grande"'//字体
},
highlight : {
segment : {
margin: 10 //空白区域宽度
},
tips : <span></span> trackMouse : true, //否启用鼠标跟踪
width : 50,
height : 28,
renderer : function(storeItem) {//自定义渲染函
var title = storeItem.get('countRate') + '%';
this.setTitle(title);
}
}
}]
}]
});
var dataStore = new Ext.data.Store({

												fields:['options', 'countRate'],

												data: [

													{options :'A', countRate : 10},

													{options :'B', countRate : 50},

													{options :'C', countRate : 30},

													{options :'D', countRate : 20}

												]

											});


