

37,738
社区成员
 发帖
发帖 与我相关
与我相关 我的任务
我的任务
 分享
分享


import matplotlib.pyplot as plt
# data
x = [0,5,9,10,15]
y = [0,1,2,3,4]
# trick to get the axes
fig,ax = plt.subplots()
# make ticks and tick labels
xticks = range(min(x),max(x)+1,3)
xticklabels = ['2000-01-0'+str(n) for n in range(1,len(xticks)+1)]
# plot data
ax.plot(x,y)
# set ticks and tick labels
ax.set_xticks(xticks)
ax.set_xticklabels(xticklabels,rotation=15)
# show the figure
plt.show()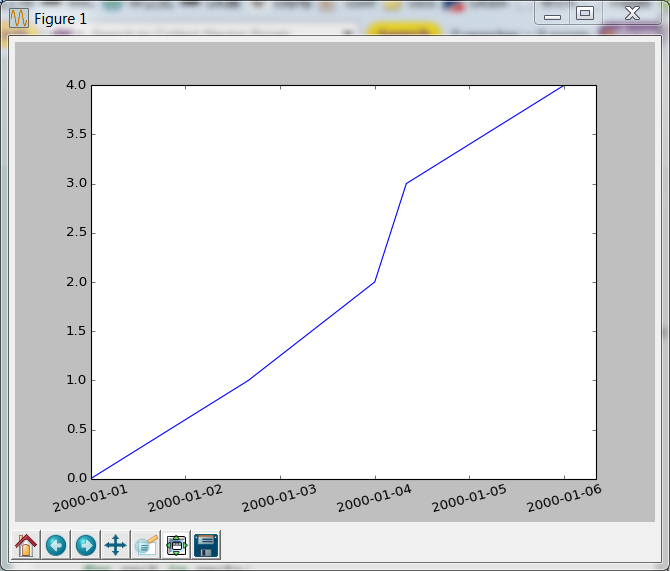

import matplotlib.pyplot as plt

x = [0,5,9,10,15]
y = [0,1,2,3,4]
plt.plot(x,y)
plt.grid(True)
plt.xticks(range(min(x),max(x)+1,3))
plt.show()
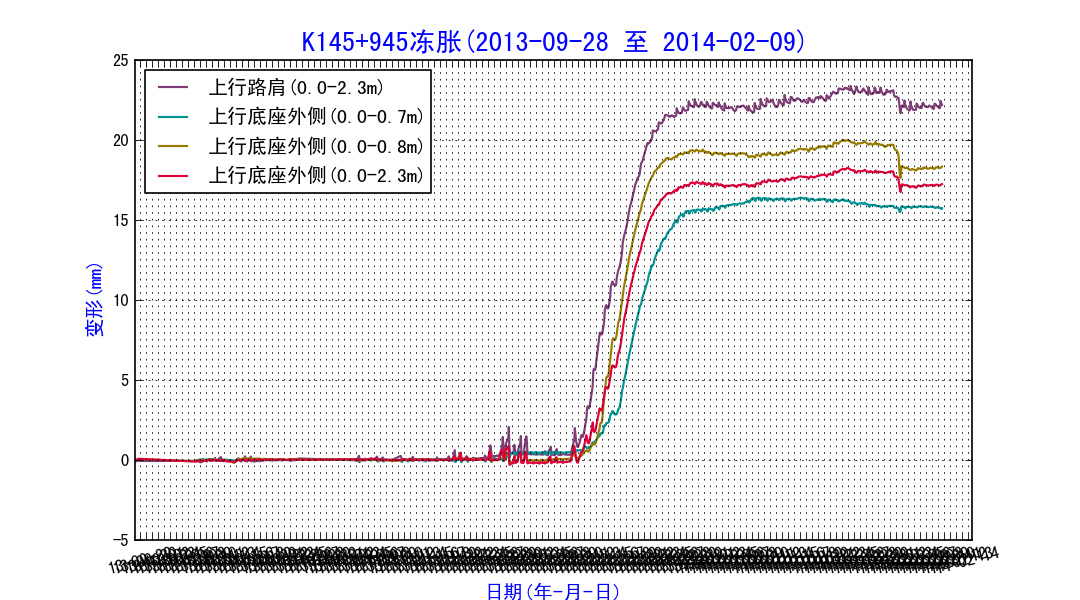
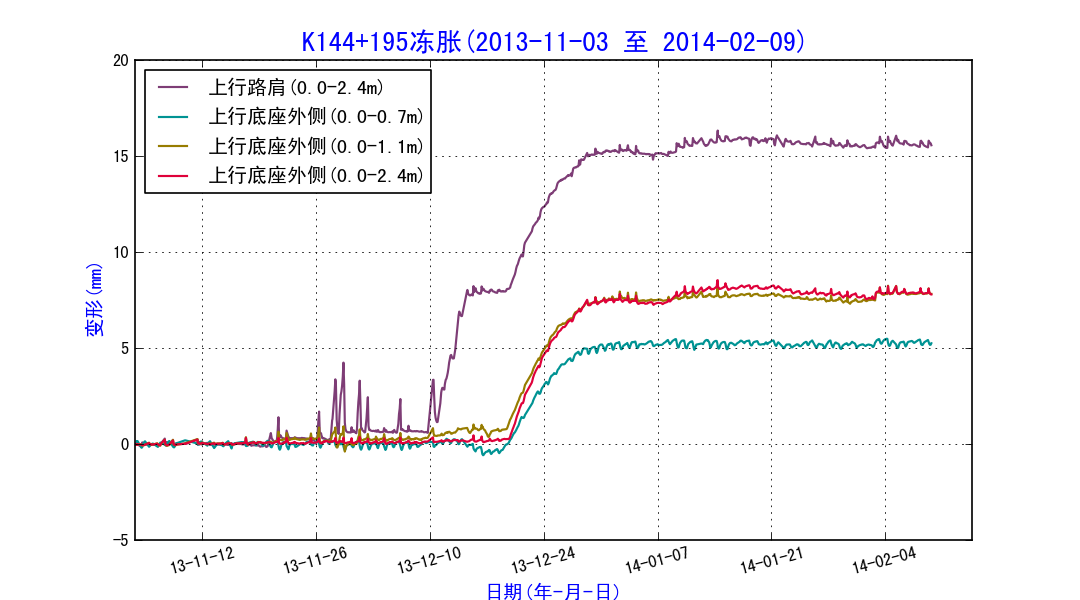
def draw_m(datas,fname,t):
    figure(figsize=(9,5))
    ax = gca()
    xss=[]
    yss=[]

    #开始画线
    c = 0
    for dm,deep_name,xs,ys in datas[::-1]:

        xss = xss+xs
        yss = yss+ys
        print deep_name

        ax.plot_date(xs,ys,colors[c],linewidth=1.3,label=u'%s'%deep_name, linestyle='-')
##        #虚线显示
##        if dm < 1.6 :
##            ax.plot_date(xs,ys,colors[c],linestyle='--',linewidth=2,label='%s'%deep_name)
##        #实线显示
##        else:
##            ax.plot_date(xs,ys,colors[c],linewidth=2,label='%s'%deep_name)
        c += 1


    #改变x,y轴刻度字体大小
    for label in ax.xaxis.get_ticklabels():
        label.set_fontsize(10)
    for label in ax.yaxis.get_ticklabels():
        label.set_fontsize(10)
    #设置x轴刻度显示时间格式
    ax.xaxis.set_major_formatter(mdate.DateFormatter('%y-%m-%d')) #x轴上的label格式为"年-月-日",其中年取后两位

    xlabels = ax.get_xticklabels()
    for xl in xlabels:
        xl.set_rotation(15) #把x轴上的label旋转15度,以免太密集时有重叠


    xstr = xlabel(u'日期(年-月-日)')
    ystr = ylabel(u'变形(mm)')

    #设置标题
    xss.sort()
    endtime = xss[len(xss)-1]
    jiesu =str(endtime)
    a=jiesu[:10]
    b=str(xss[0])[:10]
    title_name=t+u'(%s 至 %s)'%(b,a)
    tstr = title(title_name)

    grid(True)#显示网格
    #设置x轴、y轴、标题的属性
    setp(xstr,size=12,color='b')
    setp(ystr,size=12,color='b')
    setp(tstr,size=16,color='b')
##    setp(ystr,size=30,color='b')
##    setp(tstr,size=30,color='b')

    start_date = xss[0]
    end_date = endtime+timedelta(days=5)

##    if start_date>start_date1:
##       start_date= start_date1
##    xlim(start_date,end_date)


    yss.sort()
    #如果数据的最大值还小于3mm刻度范围设为-1~5
    if yss[len(yss)-1] <3:
        ylim(-1,5)


    legend(loc='upper left',prop={'size':12})
    savefig(fname,dpi=120)
    clf()


