


62,046
社区成员
 发帖
发帖 与我相关
与我相关 我的任务
我的任务
 分享
分享 chart = {
// global: {
// useUTC: false
// },
chart: {
renderTo: 'container',
zoomType: 'x',
type: 'spline'
},
title: { text: '实时曲线图' },
credits:{text: ''},
xAxis: {
type: "datetime",
// tickInterval: 5*60 * 1000,
// tickWidth: 1000 * 60 * 30, //刻度的宽度
labels: {
enable: true,
rotation: 90, //旋转,效果就是影响标签的显示方向
//step: 4,
formatter: function () {
return Highcharts.dateFormat('%Y-%m-%d %H:%M:%S', this.value);
}
},
//刻度的宽度
lineColor: '#990000',
//自定义刻度颜色
lineWidth: 1,
//自定义x轴宽度
gridLineWidth: 1
//默认是0,即在图上没有纵轴间隔线
// dateTimeLabelFormats: { // don't display the dummy year
// second: '%H:%M:%S',
// minute: '%e. %b %H:%M',
// hour: '%b/%e %H:%M'
// }
},
yAxis:
{
title: {
text: '液位高度'
},
//刻度的宽度
lineColor: '#990000',
//自定义刻度颜色
lineWidth: 1,
//自定义x轴宽度
gridLineWidth: 1,
//默认是0,即在图上没有纵轴间隔线
alternateGridColor: null,
// plotLines: [{
// value: 0,
// width: 1,
// color: '#808080'
// }],
plotBands: [{ // Light air
from: 0,
to: 100,
color: 'rgba(68, 170, 213, 0.1)',
label: {
text: '',
style: {
color: '#606060'
}
}
}, { // Light breeze
from: 100,
to: 200,
color: 'rgba(0, 0, 0, 0)',
label: {
text: '',
style: {
color: '#606060'
}
}
}, { // Gentle breeze
from: 200,
to: 300,
color: 'rgba(68, 170, 213, 0.1)',
label: {
text: '',
style: {
color: '#606060'
}
}
}, { // Moderate breeze
from: 300,
to: 400,
color: 'rgba(0, 0, 0, 0)',
label: {
text: '',
style: {
color: '#606060'
}
}
}, { // Fresh breeze
from: 400,
to: 500,
color: 'rgba(68, 170, 213, 0.1)',
label: {
text: '',
style: {
color: '#606060'
}
}
}, { // Strong breeze
from: 500,
to: 600,
color: 'rgba(0, 0, 0, 0)',
label: {
text: '',
style: {
color: '#606060'
}
}
}, { // High wind
from: 600,
to: 700,
color: 'rgba(68, 170, 213, 0.1)',
label: {
text: '',
style: {
color: '#606060'
}
}
}]
},
tooltip: {
enabled: true,
formatter: function () {
return '<b>' + this.series.name + '</b><br/>' + unix_to_datetime(this.x) + '液位高度: ' + this.y + 'mm';
}
},
plotOptions:
{
spline:
{
lineWidth: 4,
states: {
hover:
{
lineWidth: 5
}
},
marker:
{
enabled: false
}
}
},
series:[{"name":"油箱1","data":[[1393251616,555.10],[1393251646,555.60],[1393251676,555.20],[1393251706,555.90],[1393251736,555.70],[1393251767,555.70],[1393251796,555.10],[1393251826,555.70],[1393251856,555.90],[1393251886,555.20],[1393251916,555.20],[1393251946,555.20],[1393251976,555.20],[1393252005,556.10],[1393252036,555.80],[1393252066,556.10],[1393252096,556],[1393252126,556.10],[1393252156,555.10],[1393252186,556.10],[1393252216,555.40],[1393252245,555.60],[1393252275,555.90],[1393252305,555.90],[1393252335,555.60]},{"name":"油箱2","data":[[1393251616,565.10],[1393251646,555.60],[1393251676,555.20],[1393251706,555.90],[1393251736,555.70],[1393251767,585.70],[1393251796,555.10],[1393251826,535.70],[1393251856,555.90],[1393251886,555.20],[1393251916,555.20],[1393251946,555.20],[1393251976,555.20],[1393252005,556.10],[1393252036,555.80],[1393252066,516.10],[1393252096,556],[1393252126,556.10],[1393252156,555.10],[1393252186,596.10],[1393252216,555.40],[1393252245,555.60],[1393252275,555.90],[1393252305,575.90],[1393252335,515.60]}]
};
//
// for (var i = 0; i < message.length; i++)
// {
// chart.series[i] = new Object();
// chart.series[i].name=message[i].name;
// chart.series[i].data=message[i].data;
// }
//chart.redraw();
option=new Highcharts.Chart(chart);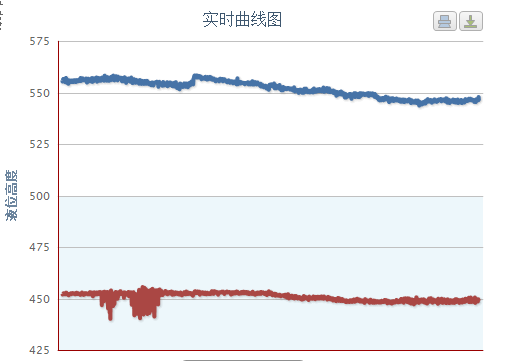


<!DOCTYPE HTML>
<html>
<head>
<script src="http://code.jquery.com/jquery-1.11.0.min.js"></script>
<script src="http://code.highcharts.com/highcharts.js"></script>
<script src="http://code.highcharts.com/modules/exporting.js"></script>
</head>
<body>
<div id="container" style="min-width: 310px; height: 400px; margin: 0 auto"></div>

<script type="text/javascript">
$(function () {
       var chart = {
//               global: {
//                   useUTC: false
//               },
               chart: {
                   renderTo: 'container',
                   zoomType: 'x',
                   type: 'spline'


               },
               title: { text: '实时曲线图' },
               credits:{text: ''},
               xAxis: {
                   type: "datetime",
                // tickInterval: 5*60 * 1000,
//                   tickWidth: 1000 * 60 * 30, //刻度的宽度
                   labels: {
                       enable: true,
                       rotation: 90, //旋转,效果就是影响标签的显示方向
                       //step: 4,
                       formatter: function () {
                           return Highcharts.dateFormat('%Y-%m-%d %H:%M:%S', this.value);
                           }
                       },
                   //刻度的宽度
                   lineColor: '#990000',
                   //自定义刻度颜色
                   lineWidth: 1,
                   //自定义x轴宽度
                   gridLineWidth: 1
                   //默认是0,即在图上没有纵轴间隔线
//                    dateTimeLabelFormats: { // don't display the dummy year
//                      second: '%H:%M:%S',
//                    minute: '%e. %b %H:%M',
//                    hour: '%b/%e %H:%M'
//                        }
               },
               yAxis:
               {
                   title: {
                       text: '液位高度'
                   },
                   //刻度的宽度
                   lineColor: '#990000',
                   //自定义刻度颜色
                   lineWidth: 1,
                   //自定义x轴宽度
                   gridLineWidth: 1,
                   //默认是0,即在图上没有纵轴间隔线
                   alternateGridColor: null,
//                   plotLines: [{
//                       value: 0,
//                       width: 1,
//                       color: '#808080'
//                   }],
                    plotBands: [{ // Light air
                    from: 0,
                    to: 100,
                    color: 'rgba(68, 170, 213, 0.1)',
                    label: {
                        text: '',
                        style: {
                            color: '#606060'
                        }
                    }
                }, { // Light breeze
                    from: 100,
                    to: 200,
                    color: 'rgba(0, 0, 0, 0)',
                    label: {
                        text: '',
                        style: {
                            color: '#606060'
                        }
                    }
                }, { // Gentle breeze
                    from: 200,
                    to: 300,
                    color: 'rgba(68, 170, 213, 0.1)',
                    label: {
                        text: '',
                        style: {
                            color: '#606060'
                        }
                    }
                }, { // Moderate breeze
                    from: 300,
                    to: 400,
                    color: 'rgba(0, 0, 0, 0)',
                    label: {
                        text: '',
                        style: {
                            color: '#606060'
                        }
                    }
                }, { // Fresh breeze
                    from: 400,
                    to: 500,
                    color: 'rgba(68, 170, 213, 0.1)',
                    label: {
                        text: '',
                        style: {
                            color: '#606060'
                        }
                    }
                }, { // Strong breeze
                    from: 500,
                    to: 600,
                    color: 'rgba(0, 0, 0, 0)',
                    label: {
                        text: '',
                        style: {
                            color: '#606060'
                        }
                    }
                }, { // High wind
                    from: 600,
                    to: 700,
                    color: 'rgba(68, 170, 213, 0.1)',
                    label: {
                        text: '',
                        style: {
                            color: '#606060'
                        }
                    }
                }]
               },
               tooltip: {
                   enabled: true,
                   formatter: function () {
                       return '<b>' + this.series.name + '</b><br/>' + this.x + '液位高度: ' + this.y + 'mm';
                   }
               },
                 plotOptions:
                   {
                        spline:
                        {
                           lineWidth: 4,
                           states: {
                               hover:
                             {
                               lineWidth: 5
                             }
                          },
                        marker:
                            {
                            enabled: false
                            }
                       }
                      },
                   series:[{"name":"油箱1","data":[[1393251616,555.10],[1393251646,555.60],[1393251676,555.20],
				   [1393251706,555.90],[1393251736,555.70],[1393251767,555.70],[1393251796,555.10],[1393251826,555.70],
				   [1393251856,555.90],[1393251886,555.20],[1393251916,555.20],[1393251946,555.20],[1393251976,555.20],
				   [1393252005,556.10],[1393252036,555.80],[1393252066,556.10],[1393252096,556],[1393252126,556.10],
				   [1393252156,555.10],[1393252186,556.10],[1393252216,555.40],[1393252245,555.60],[1393252275,555.90],
				   [1393252305,555.90],[1393252335,555.60]]},
				   {"name":"油箱2","data":[[1393251616,565.10],[1393251646,555.60],[1393251676,555.20],
				   [1393251706,555.90],[1393251736,555.70],[1393251767,585.70],[1393251796,555.10],
				   [1393251826,535.70],[1393251856,555.90],[1393251886,555.20],[1393251916,555.20],
				   [1393251946,555.20],[1393251976,555.20],[1393252005,556.10],[1393252036,555.80],
				   [1393252066,516.10],[1393252096,556],[1393252126,556.10],[1393252156,555.10],
				   [1393252186,596.10],[1393252216,555.40],[1393252245,555.60],[1393252275,555.90],
				   [1393252305,575.90],[1393252335,515.60]]}]
           };
//
//     for (var i = 0; i < message.length; i++)
//      {
//          chart.series[i] = new Object();
//          chart.series[i].name=message[i].name;
//          chart.series[i].data=message[i].data;
//      }
      //chart.redraw();
     // option=new Highcharts.Chart(chart);

        $('#container').highcharts(chart);
    });

</script>
</body>

</html>


