脚本语言

python log函數轉成call graph
 墨衍会员 · AI 创作全网分发 墨衍智能分发 通过墨衍一键同步至各平台 可同步平台 CSDN微信公众号微博知乎掘金百家号博客园抖音小红书 你的文章也可以这样分发 墨衍会员 ¥399起/年,写一次发全网
我也要 关注 + 加入社区
enter main test.c:85

enter func1 test.c:70

enter func2 test.c:67

leave func2 test.c:67

enter func3 test.c:75

enter func4 test.c:80

leave func4 test.c:80

leave func3 test.c:75

leave func1 test.c:70

enter func3 test.c:75

enter func4 test.c:80

leave func4 test.c:80

leave func3 test.c:75

leave main test.c:85
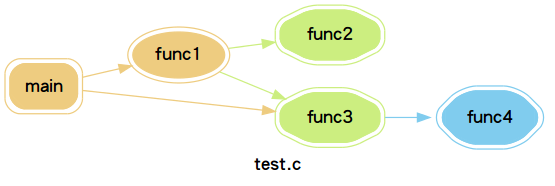
怎么透过函数 enter and leave 转成下面 dot 格式 ?
digraph G {

node [peripheries=2 style="filled,rounded" fontname="Vera Sans YuanTi Mono" color="#eecc80"];

rankdir=LR;

label="test.c"

main [shape=box];

node [color="#eecc80" shape=ellipse];edge [color="#eecc80"];

main->func1

node [color="#ccee80" shape=octagon];edge [color="#ccee80"];

func1->func2

node [color="#ccee80" shape=octagon];edge [color="#ccee80"];

func1->func3

node [color="#80ccee" shape=hexagon];edge [color="#80ccee"];

func3->func4

node [color="#eecc80" shape=ellipse];edge [color="#eecc80"];

main->func3

}
相关推荐
gdb_graphs:使用gdb和python可视化CC ++程序的函数调用流
gen_graph.py 描述 使用 graphviz 点对象和 matplotlib 可视化 C/C++ 程序的函数调用流的 Python 命令行工具。 Directory structure: ├── gallery │ ├── graph_GNU_MAKE_.png │ ├── graph_QEMU.png │ ├── graph_VIM.png │ ├── some_library_graph.png │ ├── test.png │ └── test.svg ├── gen_graph.py ├── LICENSE ├── README.md ├── requiments.txt └── test ├── test.c └── test.log 动机 我想查看OS源(用C,C ++编写)的调用图,该源连接了一层内的API和跨层的API。
Python实现决策树并且使用Graphvize可视化的例子
今天小编就为大家分享一篇Python实现决策树并且使用Graphvize可视化的例子,具有很好的参考价值,希望对大家有所帮助。一起跟随小编过来看看吧
Eppstein-Algorithm-in-Python:Eppstein 的算法使用图转换技术。 该模型还可以找到从给定源 s 到图中每个顶点的 K 条最短路径,总时间为 O(m + n log n + kn)。 在 Python 中实现
Eppstein-Python 中的算法
Python几种常见算法汇总
主要介绍了如何用Python实现几种常见算法,文中代码简单易懂,方便大家更好的学习,感兴趣的朋友可以了解下
Data-Structures-and-Algorithms:主要以python语言
数据结构与算法