最近在弄关于内存泄漏的问题,快崩溃了。。。救助大神!!!!

hylh112er 2014-07-01 11:00:09
我尽量把问题描述清楚:我在MFC下做了一个界面,里面有四个模块儿(其实主要有三个),分别是:读入一幅图像、去噪、模糊核估计、反卷积。这四个过程是连续的,不是并行处理的。

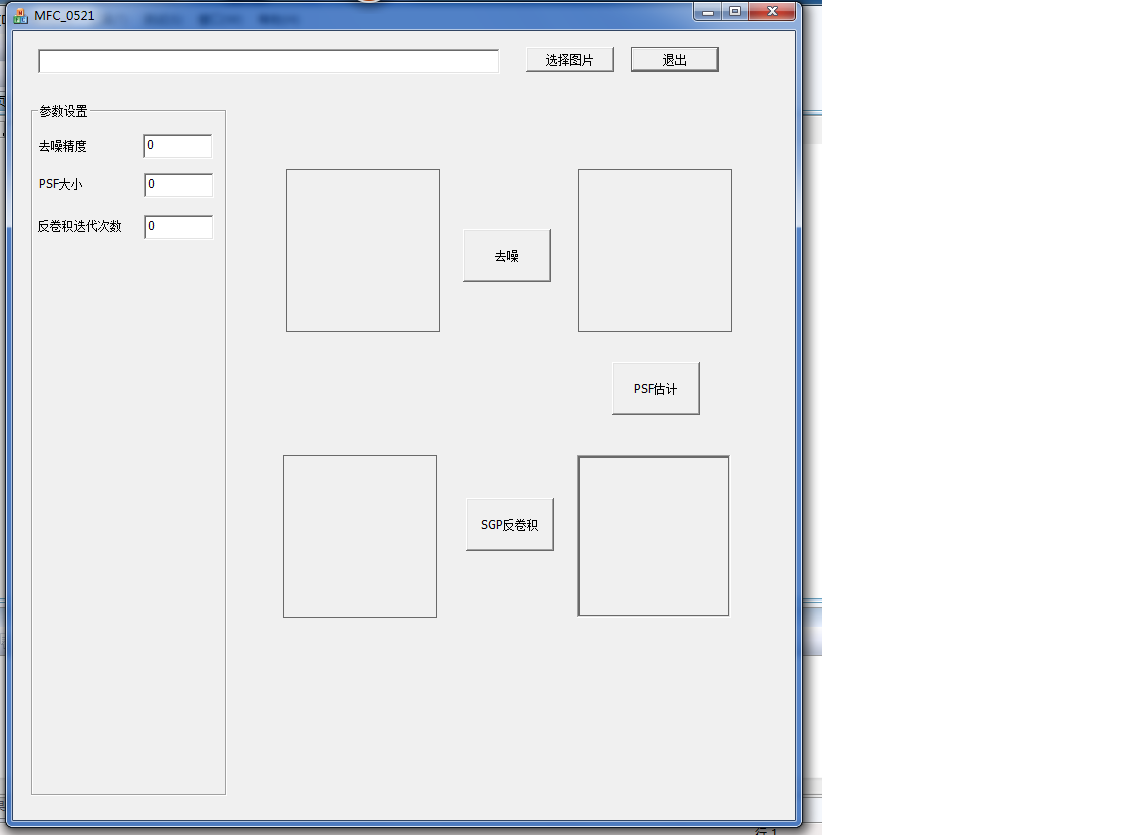
算法我是用matlab研究仿真的(本质上我是做算法研究的。。),然后呢,我想把它做成一个软件,所以就在MFC下作了这样一个界面。
至于代码,我先解释一下,首先matlab的coder工具可以将matlab的函数文件在一定条件下转成独立的C/c++代码,这个我事先研究过了,并发表了论文,没什么问题。所以一开始,我直接将去噪、模糊核估计、反卷积的代码转成了C++代码(转的过程也很痛苦,因为算法相对比较复杂,这也是我不自己编写的原因!!),后来想还是自己手写的更好,出于简单考虑,我只自己编了第一个,也就是去噪的代码。后两个实在太复杂,我只能转了。转的代码虽然看着很乱,但其实写的挺完善。

现在出现的问题是,当运行到第二个模块儿,也就是模糊核(PSF)估计的时候,极其容易卡死,就是很容易出现停止工作的字样。这里需要提的是没有出现死循环;我还未设置多线程

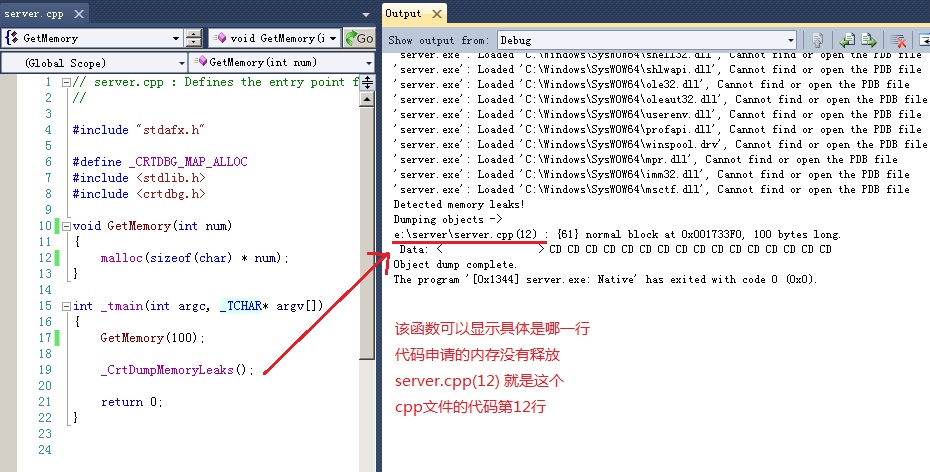
很多人告诉我是内存泄漏的问题,我从网上找了这么一个函数对:_CrtMemState s1, s2, s3;_CrtMemCheckpoint(&s1);{代码块}; _CrtMemCheckpoint(&s2); if(_CrtMemDifference(&s3, &s1, &s2));_CrtMemDumpStatistics(&s3);
然后,我抛开MFC,以新的工程的形式单独测试几个模块儿,然后发现了一下问题:
1、第一个模块(去噪),是我自己写的代码,测试结果如下:
1)检测调用函数之前的声明部分,显示一定的数值,这个可以理解,因为分配了内存还未使用;
2)单独检测调用的函数(即我自己写的函数代码),结果是0,没问题;
3)然后整个测试流程,最后把结果free掉之后,没有任何内存泄漏;
4)在最后free之前,也就是包含声明和调用函数两部分,有内存泄漏,但是数值和检测声明部分相同!!(可见,第一个模块儿没什么问题!)
2、后两个模块儿结果时一样的:
1)检测调用函数之前的声明部分,显示一定的数值,这个可以理解,因为分配了内存还未使用;
2)单独检测调用的函数(即转的的函数代码),结果是0,没问题;
3)问题在这里:在最后free之前,也就是包含声明和调用函数两部分,有内存泄漏,而且数值相比声明部分的急剧增加!!比如:380865039 bytes!(是不是很大啊?)
这个我就不理解了,这是什么原因造成的呢?

我是通信专业的,一般的编程还可以,可是这种问题从未碰到过,很多人给我稍微解释就算了,我也不好意思使劲问,但是确实自己不熟,而且我时间有限,还希望大神不吝赐教!!我分不多,解决的我全给了!!!
...全文
359 9 打赏 收藏 转发到动态 举报
写回复
用AI写文章
9 条回复
切换为时间正序
请发表友善的回复…
发表回复
FrankHB1989 2014-07-02
  • 打赏
  • 举报
回复
源码检查不靠谱,编译带debug信息然后用DrMemory什么的跑一下试试。
赵4老师 2014-07-02
  • 打赏
  • 举报
回复
_CrtMemCheckpoint Obtains the current state of the debug heap and stores in an application-supplied _CrtMemState structure (debug version only). void _CrtMemCheckpoint( _CrtMemState *state ); Routine Required Header Compatibility _CrtMemCheckpoint <crtdbg.h> Win NT, Win 95 For additional compatibility information, see Compatibility in the Introduction. Libraries LIBCD.LIB Single thread static library, debug version LIBCMTD.LIB Multithread static library, debug version MSVCRTD.LIB Import library for MSVCRTD.DLL, debug version Return Value None Parameter state Pointer to _CrtMemState structure to fill with the memory checkpoint Remarks The _CrtMemCheckpoint function creates a snapshot of the current state of the debug heap at any given moment, which can be used by other heap state functions to help detect memory leaks and other problems. When _DEBUG is not defined, calls to _CrtMemState are removed during preprocessing. The application must pass a pointer to a previously allocated instance of the _CrtMemState structure, defined in CRTDBG.H, in the state parameter. If _CrtMemCheckpoint encounters an error during the checkpoint creation, the function generates a _CRT_WARN debug report describing the problem. For more information about heap state functions and the _CrtMemState structure, see Heap State Reporting Functions. For information about how memory blocks are allocated, initialized, and managed in the debug version of the base heap, see Memory Management and the Debug Heap. Example /***************************************************************** * EXAMPLE 1 * * This simple program illustrates the basic debugging features * * of the C runtime libraries, and the kind of debug output * * that these features generate. * *****************************************************************/ #include <stdio.h> #include <string.h> #include <malloc.h> #include <crtdbg.h> // This routine place comments at the head of a section of debug output void OutputHeading( const char * explanation ) { _RPT1( _CRT_WARN, "\n\n%s:\n**************************************\ ************************************\n", explanation ); } // The following macros set and clear, respectively, given bits // of the C runtime library debug flag, as specified by a bitmask. #ifdef _DEBUG #define SET_CRT_DEBUG_FIELD(a) \ _CrtSetDbgFlag((a) | _CrtSetDbgFlag(_CRTDBG_REPORT_FLAG)) #define CLEAR_CRT_DEBUG_FIELD(a) \ _CrtSetDbgFlag(~(a) & _CrtSetDbgFlag(_CRTDBG_REPORT_FLAG)) #else #define SET_CRT_DEBUG_FIELD(a) ((void) 0) #define CLEAR_CRT_DEBUG_FIELD(a) ((void) 0) #endif void main( ) { char *p1, *p2; _CrtMemState s1, s2, s3; // Send all reports to STDOUT _CrtSetReportMode( _CRT_WARN, _CRTDBG_MODE_FILE ); _CrtSetReportFile( _CRT_WARN, _CRTDBG_FILE_STDOUT ); _CrtSetReportMode( _CRT_ERROR, _CRTDBG_MODE_FILE ); _CrtSetReportFile( _CRT_ERROR, _CRTDBG_FILE_STDOUT ); _CrtSetReportMode( _CRT_ASSERT, _CRTDBG_MODE_FILE ); _CrtSetReportFile( _CRT_ASSERT, _CRTDBG_FILE_STDOUT ); // Allocate 2 memory blocks and store a string in each p1 = malloc( 34 ); strcpy( p1, "This is the p1 string (34 bytes)." ); p2 = malloc( 34 ); strcpy( p2, "This is the p2 string (34 bytes)." ); OutputHeading( "Use _ASSERTE to check that the two strings are identical" ); _ASSERTE( strcmp( p1, p2 ) == 0 ); OutputHeading( "Use a _RPT macro to report the string contents as a warning" ); _RPT2( _CRT_WARN, "p1 points to '%s' and \np2 points to '%s'\n", p1, p2 ); OutputHeading( "Use _CRTMemDumpAllObjectsSince to check the p1 and p2 allocations" ); _CrtMemDumpAllObjectsSince( NULL ); free( p2 ); OutputHeading( "Having freed p2, dump allocation information about p1 only" ); _CrtMemDumpAllObjectsSince( NULL ); // Store a memory checkpoint in the s1 memory-state structure _CrtMemCheckpoint( &s1 ); // Allocate another block, pointed to by p2 p2 = malloc( 38 ); strcpy( p2, "This new p2 string occupies 38 bytes."); // Store a 2nd memory checkpoint in s2 _CrtMemCheckpoint( &s2 ); OutputHeading( "Dump the changes that occurred between two memory checkpoints" ); if ( _CrtMemDifference( &s3, &s1, &s2 ) ) _CrtMemDumpStatistics( &s3 ); // Free p2 again and store a new memory checkpoint in s2 free( p2 ); _CrtMemCheckpoint( &s2 ); OutputHeading( "Now the memory state at the two checkpoints is the same" ); if ( _CrtMemDifference( &s3, &s1, &s2 ) ) _CrtMemDumpStatistics( &s3 ); strcpy( p1, "This new p1 string is over 34 bytes" ); OutputHeading( "Free p1 after overwriting the end of the allocation" ); free( p1 ); // Set the debug-heap flag so that freed blocks are kept on the // linked list, to catch any inadvertent use of freed memory SET_CRT_DEBUG_FIELD( _CRTDBG_DELAY_FREE_MEM_DF ); p1 = malloc( 10 ); free( p1 ); strcpy( p1, "Oops" ); OutputHeading( "Perform a memory check after corrupting freed memory" ); _CrtCheckMemory( ); // Use explicit calls to _malloc_dbg to save file name and line number // information, and also to allocate Client type blocks for tracking p1 = _malloc_dbg( 40, _NORMAL_BLOCK, __FILE__, __LINE__ ); p2 = _malloc_dbg( 40, _CLIENT_BLOCK, __FILE__, __LINE__ ); strcpy( p1, "p1 points to a Normal allocation block" ); strcpy( p2, "p2 points to a Client allocation block" ); // You must use _free_dbg to free a Client block OutputHeading( "Using free( ) to free a Client block causes an assertion failure" ); free( p1 ); free( p2 ); p1 = malloc( 10 ); OutputHeading( "Examine outstanding allocations (dump memory leaks)" ); _CrtDumpMemoryLeaks( ); // Set the debug-heap flag so that memory leaks are reported when // the process terminates. Then, exit. OutputHeading( "Program exits without freeing a memory block" ); SET_CRT_DEBUG_FIELD( _CRTDBG_LEAK_CHECK_DF ); } Output Use _ASSERTE to check that the two strings are identical: ************************************************************************** C:\DEV\EXAMPLE1.C(56) : Assertion failed: strcmp( p1, p2 ) == 0 Use a _RPT macro to report the string contents as a warning: ************************************************************************** p1 points to 'This is the p1 string (34 bytes).' and p2 points to 'This is the p2 string (34 bytes).' Use _CRTMemDumpAllObjectsSince to check the p1 and p2 allocations: ************************************************************************** Dumping objects -> {13} normal block at 0x00660B5C, 34 bytes long Data: <This is the p2 s> 54 68 69 73 20 69 73 20 74 68 65 20 70 32 20 73 {12} normal block at 0x00660B10, 34 bytes long Data: <This is the p1 s> 54 68 69 73 20 69 73 20 74 68 65 20 70 31 20 73 Object dump complete. Having freed p2, dump allocation information about p1 only: ************************************************************************** Dumping objects -> {12} normal block at 0x00660B10, 34 bytes long Data: <This is the p1 s> 54 68 69 73 20 69 73 20 74 68 65 20 70 31 20 73 Object dump complete. Dump the changes that occurred between two memory checkpoints: ************************************************************************** 0 bytes in 0 Free Blocks. 38 bytes in 1 Normal Blocks. 0 bytes in 0 CRT Blocks. 0 bytes in 0 IgnoreClient Blocks. 0 bytes in 0 (null) Blocks. Largest number used: 4 bytes. Total allocations: 38 bytes. Now the memory state at the two checkpoints is the same: ************************************************************************** Free p1 after overwriting the end of the allocation: ************************************************************************** memory check error at 0x00660B32 = 0x73, should be 0xFD. memory check error at 0x00660B33 = 0x00, should be 0xFD. DAMAGE: after Normal block (#12) at 0x00660B10. Perform a memory check after corrupting freed memory: ************************************************************************** memory check error at 0x00660B10 = 0x4F, should be 0xDD. memory check error at 0x00660B11 = 0x6F, should be 0xDD. memory check error at 0x00660B12 = 0x70, should be 0xDD. memory check error at 0x00660B13 = 0x73, should be 0xDD. memory check error at 0x00660B14 = 0x00, should be 0xDD. DAMAGE: on top of Free block at 0x00660B10. DAMAGED located at 0x00660B10 is 10 bytes long. Using free( ) to free a Client block causes an assertion failure: ************************************************************************** dbgheap.c(1039) : Assertion failed: pHead->nBlockUse == nBlockUse Examine outstanding allocations (dump memory leaks): ************************************************************************** Detected memory leaks! Dumping objects -> {18} normal block at 0x00660BE4, 10 bytes long Data: < > CD CD CD CD CD CD CD CD CD CD Object dump complete. Program exits without freeing a memory block: ************************************************************************** Detected memory leaks! Dumping objects -> {18} normal block at 0x00660BE4, 10 bytes long Data: < > CD CD CD CD CD CD CD CD CD CD Object dump complete. Debug Functions
zilaishuichina 2014-07-02
  • 打赏
  • 举报
回复
modyaj 2014-07-02
  • 打赏
  • 举报
回复
话说楼主只能自己奋斗了 没有代码 大家估计也说不出个什么来 一般 调试 追踪 打印必要的log日志 还有就是屏蔽块代码定位 还有学些没什么不好意思问的
黑娃 2014-07-02
  • 打赏
  • 举报
回复
只能去仔细看看出问题的代码了,没有其他办法能帮到你,你也只需要看看malloc和new、relloc等等会开辟内存的地方
我看你有戏 2014-07-02
  • 打赏
  • 举报
回复
先把关键调用的地方先屏蔽了,然后运行程序看看是否会泄漏 然后一点点把注释去掉,像剥笋一样一层层的去剥开
layershow 2014-07-01
  • 打赏
  • 举报
回复
没代码真的没法帮忙啊 我有几个问题,这个数据是固定的吗?每次都是380865039? 换一副图像也是这个数吗? 不止内存泄漏会这样,考虑内存越界问题……
碼上道 2014-07-01
  • 打赏
  • 举报
回复
还是不太懂楼主讲的,使用工具检测,另外,可以直接注释一些代码,将算法再运行,找出泄漏的部分。300M+内存泄漏是很大了。
xuzhouweihao 2014-07-01
  • 打赏
  • 举报
回复
hi hylh112er 内存泄露的话可以使用一些工具来进行测试。 linux下可以使用valgrind windows下可以使用VLD(Visual Leak Detector) 多运行段时间就可以看出哪里的内存没有被释放了。 希望对你有所帮助。

64,654

社区成员

发帖
与我相关
我的任务
社区描述
C++ 语言相关问题讨论,技术干货分享,前沿动态等
c++ 技术论坛(原bbs)
社区管理员
  • C++ 语言社区
  • encoderlee
  • paschen
加入社区
  • 近7日
  • 近30日
  • 至今
社区公告
  1. 请不要发布与C++技术无关的贴子
  2. 请不要发布与技术无关的招聘、广告的帖子
  3. 请尽可能的描述清楚你的问题,如果涉及到代码请尽可能的格式化一下

试试用AI创作助手写篇文章吧