


81,092
社区成员
 发帖
发帖 与我相关
与我相关 我的任务
我的任务
 分享
分享


<%@ page language="java" import="java.util.*" pageEncoding="utf-8"%>
<%@page import="java.util.ArrayList" %>
<%@ page import="com.scce.common.mxBean" %>
<%@ page import="java.util.ArrayList"%>
<%@page import="java.sql.ResultSet"%>
<%@ page import="com.scce.common.BaseDB"  %>

<%
String path = request.getContextPath();
String basePath = request.getScheme()+"://"+request.getServerName()+":"+request.getServerPort()+path+"/";
%>
  <%
   ArrayList mxList=(ArrayList)request.getAttribute("mxList");
   mxBean mxs=new mxBean();
   for(int i=0;i<mxList.size();i++)
   {
       mxs=(mxBean)mxList.get(i);
%>
  <!--  <input type="text" value="<%=mxs.getName() %>" id="<%=i%>"/>  -->


<%
   }
%>
<!DOCTYPE HTML PUBLIC "-//W3C//DTD HTML 4.01 Transitional//EN">
<html>
<head>
<meta http-equiv="Content-Type" content="text/html; charset=utf-8" />
	<title>Stencils example for mxGraph</title>

	<!-- Sets the basepath for the library if not in same directory -->
	<script type="text/javascript">
</script>

	<script type="text/javascript">
		mxBasePath = 'src';
	</script>

	<!-- Loads and initializes the library -->
	<script type="text/javascript" src="src/js/mxClient.js"></script>

	<!-- Example code -->
	<script type="text/javascript">
		// Program starts here. Creates a sample graph in the
		// DOM node with the specified ID. This function is invoked


		function main(container)
		{
			// Checks if the browser is supported
			if (!mxClient.isBrowserSupported())
			{
				// Displays an error message if the browser is not supported.
				mxUtils.error('Browser is not supported!', 200, false);
			}
			else
			{
				// Enables crisp rendering of rectangles in SVG
				mxRectangleShape.prototype.crisp = true;

				// Sets the global shadow color
				mxConstants.SHADOWCOLOR = '#C0C0C0';
				mxConstants.SHADOW_OPACITY = 0.5;
				mxConstants.SHADOW_OFFSET_X = 4;
				mxConstants.SHADOW_OFFSET_Y = 4;

				// Uses the shape for resize previews
				// 禁用浏览器默认的右键菜单栏
				mxEvent.disableContextMenu(container);
				// Loads the stencils into the registry


				// Creates the graph inside the given container
				var graph = new mxGraph(container);
				// Disables basic selection and cell handling
					graph.setEnabled(false);
				// Changes default styles
				var style = graph.getStylesheet().getDefaultEdgeStyle();
				style[mxConstants.STYLE_EDGE] = 'orthogonalEdgeStyle';
				style = graph.getStylesheet().getDefaultVertexStyle();
				style[mxConstants.STYLE_FILLCOLOR] = '#adc5ff';
				style[mxConstants.STYLE_GRADIENTCOLOR] = '#7d85df';
				style[mxConstants.STYLE_SHADOW] = '1';

				// Enables rubberband selection
				new mxRubberband(graph);

				// Gets the default parent for inserting new cells. This
				// is normally the first child of the root (ie. layer 0).
				var parent = graph.getDefaultParent();

				// Adds cells to the model in a single step
				graph.getModel().beginUpdate();

				try
				{
					var v101 = graph.insertVertex(parent, null, '<%=((mxBean)mxList.get(0)).getName()%>', 230, 30, 90, 30, 'fillColor=#0C0;gradientcolor=#000000');
					var v201 = graph.insertVertex(parent, null, '<%=((mxBean)mxList.get(1)).getName()%>', 180, 130, 40, 80, null );
					var v202 = graph.insertVertex(parent, null, '<%=((mxBean)mxList.get(4)).getName()%>', 330, 130, 40, 80, 'shape=and' );
					var v301 = graph.insertVertex(parent, null, '<%=((mxBean)mxList.get(2)).getName()%>', 130, 260, 40, 80, 'shape=and' );
					var v302 = graph.insertVertex(parent, null, '<%=((mxBean)mxList.get(3)).getName()%>', 230, 260, 40, 80, 'shape=and' );
					var v303 = graph.insertVertex(parent, null, '<%=((mxBean)mxList.get(5)).getName()%>', 330, 260, 40, 80, 'shape=and' );
					var e1 = graph.insertEdge(parent, null, '', v101, v201);


					var e2 = graph.insertEdge(parent, null, '', v101, v202);

					var e3 = graph.insertEdge(parent, null, '', v201, v301);
					var e4 = graph.insertEdge(parent, null, '', v201, v302);
					var e5 = graph.insertEdge(parent, null, '', v202, v303);
					/*var v1 = graph.insertVertex(parent, null, 'A1', 20, 20, 40, 80, 'shape=and');
					var v2 = graph.insertVertex(parent, null, 'A2', 20, 220, 40, 80, 'shape=and');
					var v3 = graph.insertVertex(parent, null, 'X1', 160, 110, 80, 80, 'shape=xor');
					var e1 = graph.insertEdge(parent, null, '', v1, v3);
					e1.geometry.points = [new mxPoint(90, 60), new mxPoint(90, 130)];
					var e2 = graph.insertEdge(parent, null, '', v2, v3);
					e2.geometry.points = [new mxPoint(90, 260), new mxPoint(90, 170)];

					var v4 = graph.insertVertex(parent, null, 'A3', 520, 20, 40, 80, 'shape=and;flipH=1');
					var v5 = graph.insertVertex(parent, null, 'A4', 520, 220, 40, 80, 'shape=and;flipH=1');
					var v6 = graph.insertVertex(parent, null, 'X2', 340, 110, 80, 80, 'shape=xor;flipH=1');
					var e3 = graph.insertEdge(parent, null, '', v4, v6);
					e3.geometry.points = [new mxPoint(490, 60), new mxPoint(130, 130)];
					var e4 = graph.insertEdge(parent, null, '', v5, v6);
					e4.geometry.points = [new mxPoint(490, 260), new mxPoint(130, 170)];

					var v7 = graph.insertVertex(parent, null, 'O1', 250, 260, 80, 60, 'shape=or;direction=south');
					var e5 = graph.insertEdge(parent, null, '', v6, v7);
					e5.geometry.points = [new mxPoint(310, 150)];
					var e6 = graph.insertEdge(parent, null, '', v3, v7);
					e6.geometry.points = [new mxPoint(270, 150)];

					var e7 = graph.insertEdge(parent, null, '', v7, v5);
					e7.geometry.points = [new mxPoint(290, 370)];*/
				}
				finally
				{
					// Updates the display
					graph.getModel().endUpdate();
				}


				document.body.appendChild(document.createTextNode('\u00a0'));
				document.body.appendChild(document.createTextNode('\u00a0'));
				document.body.appendChild(document.createTextNode('\u00a0'));
				document.body.appendChild(document.createTextNode('\u00a0'));

				document.body.appendChild(document.createTextNode('\u00a0'));
				document.body.appendChild(document.createTextNode('\u00a0'));
				document.body.appendChild(document.createTextNode('\u00a0'));
				document.body.appendChild(document.createTextNode('\u00a0'));

			}
		};
	</script>
</head>


<!-- Page passes the container for the graph to the program -->
<body onLoad="main(document.getElementById('graphContainer'))">

	<!-- Creates a container for the graph with a grid wallpaper -->
	<div id="graphContainer"
		style="cursor:default; #0C0">
	</div>


</body>
</html>

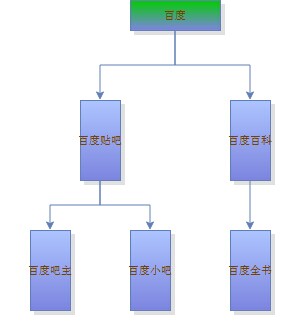 现在是横排的 想变成竖排下来
这是现在显示出来的样子[/quote]
那你要怎么个竖排,是菜单里面的字"百度"变成
百
度
这样的?
现在是横排的 想变成竖排下来
这是现在显示出来的样子[/quote]
那你要怎么个竖排,是菜单里面的字"百度"变成
百
度
这样的?<ul>
<li>菜单1</li>
<li>菜单2</li>
……
</ul>
