求问柱状图如何显示出坐标的具体数值?

winseer 2014-08-15 04:57:50

想用.net 自带的DataVisualization控件绘图,柱状图,如下图所示,出来的效果很漂亮 ,但有一个问题没有解决,就是如何在柱状图上显示出此柱的具体数值?
请大家指教。
或者有没有更好用的绘图组件,也可以给推荐一下。

附图,附源码。


源码:

http://dldx.csdn.net/fd.php?i=403359608298846&s=5e6acf375353a129298af67464d4a051
http://download.csdn.net/detail/melodylovema/5960829


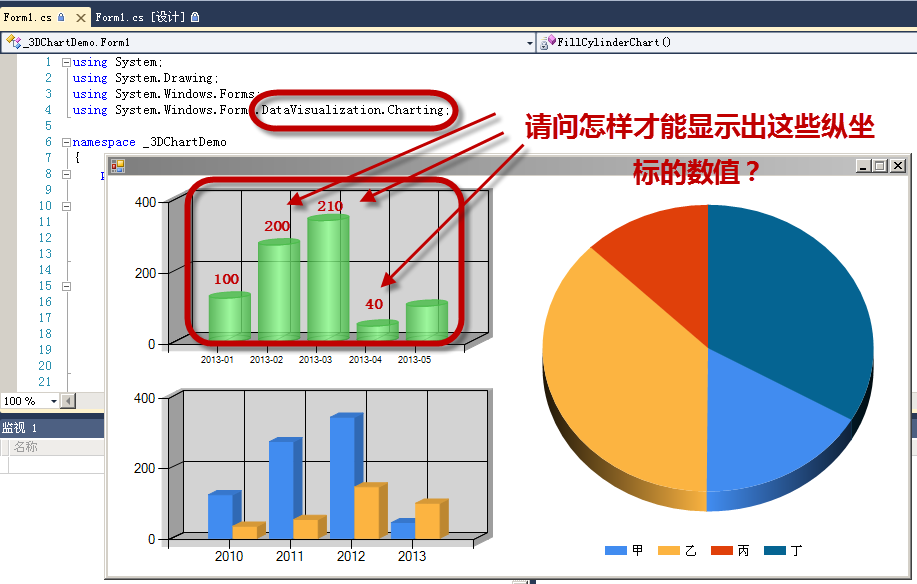
            string[] x = new string[] { "2013-01", "2013-02", "2013-03", "2013-04", "2013-05" };//横坐标集
int[] y = new int[] { 123, 273, 342, 44,100 }; //纵坐标集

this.chart1.Legends.Clear();

this.chart1.ChartAreas[0].Area3DStyle.Enable3D = true;
this.chart1.ChartAreas[0].Area3DStyle.LightStyle = LightStyle.Realistic;
this.chart1.ChartAreas[0].Area3DStyle.Inclination = 30;
this.chart1.ChartAreas[0].Area3DStyle.PointDepth = 50;
//this.chart1.ChartAreas[0].AxisX.IntervalAutoMode = IntervalAutoMode.VariableCount;
this.chart1.Series[0].ChartType = SeriesChartType.Column;
this.chart1.Series[0]["DrawingStyle"] = "Cylinder";
this.chart1.Series[0].Points.DataBindXY(x, y);

this.chart1.Series[0].Color = Color.FromArgb(210, 100, 255, 100);
this.chart1.Series[0].LegendToolTip = "aaa";


请大家指教。
...全文
964 2 打赏 收藏 转发到动态 举报
写回复
用AI写文章
2 条回复
切换为时间正序
请发表友善的回复…
发表回复
  • 打赏
  • 举报
回复
绘制3D柱形图分析数据的具体数值 protected void Page_Load(object sender, EventArgs e) { //创建一个字符串数组,保存各季度名称 string[] monNum = new string[4]; //创建一个字符串数组,保存各季度营业额 string[] monCount = new string[4]; //创建生成随机数对象 Random rd = new Random(); //使用for循环赋值 for (int i = 0; i < 4; i++) { monNum[i] = Convert.ToString(i + 1); monCount[i] = (rd.Next(200)).ToString(); } //创建一个字符串变量,保存各季度名称 string strXdata = string.Empty; foreach (string strData in monNum) { strXdata += strData + "季度\t"; } //创建一个字符串变量,保存各季度营业额 string strYdata = string.Empty; foreach (string strValue in monCount) { strYdata += strValue + "\t"; } //创建图表工作区 ChartSpace laySpace = new ChartSpaceClass(); //在图表工作区中添加一个图表 ChChart InsertChart = laySpace.Charts.Add(0); //设置图表类型为3d柱形图 InsertChart.Type = ChartChartTypeEnum.chChartTypeColumnClustered3D; //设置图表是否具有图例 InsertChart.HasLegend = true; //设置图表是否具有标题 InsertChart.HasTitle = true; InsertChart.Title.Caption = "全年季度销售额"; //设置x坐标是否具有标题 InsertChart.Axes[0].HasTitle = true; //设置x坐标标题内容 InsertChart.Axes[0].Title.Caption = "X: 月份"; //设置y坐标是否具有标题 InsertChart.Axes[1].HasTitle = true; //设置最小的数轴值 InsertChart.Axes[1].Scaling.SplitMinimum = 50; //设置y坐标标题内容 InsertChart.Axes[1].Title.Caption = "Y: 数量"; //指定新图表的位置 InsertChart.SeriesCollection.Add(0); //设置分类的值 InsertChart.SeriesCollection[0].SetData(ChartDimensionsEnum.chDimCategories, +(int)ChartSpecialDataSourcesEnum.chDataLiteral, strXdata); //设置图表的值 InsertChart.SeriesCollection[0].SetData(ChartDimensionsEnum.chDimValues, +(int)ChartSpecialDataSourcesEnum.chDataLiteral,strYdata) ; //设置图表颜色 InsertChart.SeriesCollection[0].Interior.Color = "#99E6FC"; //显示图表中所有标志 ChDataLabels dls = InsertChart.SeriesCollection[0].DataLabelsCollection.Add(); //设置标志的大小 dls.Font.Size = 10; //设置标志边框颜色 dls.Border.Color = "red"; //设置标志为粗体 dls.Font.Bold = true; //字符串变量用来保存生成图片的路径 string strAbsolutePath = Server.MapPath(".") + "\\sq.gif"; //将图表保存为图片文件 laySpace.ExportPicture(strAbsolutePath, "GIF", 600, 350); //创建图像标记 string strImageTag = "<IMG src=\"sq.gif\"/>"; //将图像显示在页面中 this.PlaceHolder1.Controls.Add(new LiteralControl(strImageTag)); }
熙风 2014-08-15
  • 打赏
  • 举报
回复
chart1.Titles[0].Text ?

110,539

社区成员

发帖
与我相关
我的任务
社区描述
.NET技术 C#
社区管理员
  • C#
  • Web++
  • by_封爱
加入社区
  • 近7日
  • 近30日
  • 至今
社区公告

让您成为最强悍的C#开发者

试试用AI创作助手写篇文章吧