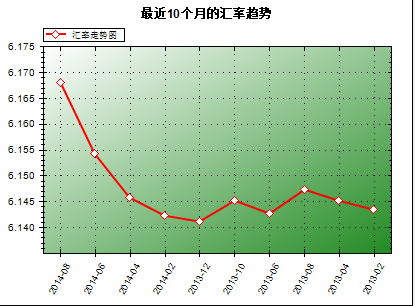
如上图为什么那条曲线,上每个点不显示Y轴的值啊,代码如下
GraphPane myPane = zgc.GraphPane;
// Set the titles and axis labels
myPane.Title.Text = "最近10个月的汇率趋势";
myPane.XAxis.Title.Text = "日期";
myPane.YAxis.Title.Text = "汇率";
myPane.XAxis.Title.IsVisible = false;
myPane.YAxis.Title.IsVisible = false;
myPane.XAxis.MajorGrid.IsVisible = true; //珊格子
myPane.YAxis.MajorGrid.IsVisible = true;
Double[] y = new Double[10];
string[] x = new string[10];
string cmdstr2 = "SELECT TOP 10 [汇率日期],[汇率单价] FROM [Process Cost].[dbo].[汇率List] order by [添加日期] desc";
SqlConnection con2 = new SqlConnection(connstr);
con2.Open();
SqlDataAdapter dap2 = new SqlDataAdapter(cmdstr2, con2);
DataSet ds2 = new DataSet();
dap2.Fill(ds2);
if (ds2.Tables[0].Rows.Count > 0)
{
for (int i = 0; i < ds2.Tables[0].Rows.Count; i++)
{
y[i] = Convert.ToDouble(ds2.Tables[0].Rows[i][1].ToString());
x[i] = ds2.Tables[0].Rows[i][0].ToString();
}
}
con2.Close();
con2.Dispose();
// Hide the legend
myPane.Legend.IsVisible = true;
// Add a curve
LineItem curve = myPane.AddCurve("汇率走势图", null, y, Color.Red, SymbolType.Diamond);
curve.Line.Width = 2.0F;
curve.Line.IsAntiAlias = true;
curve.Symbol.Fill = new Fill(Color.White);
curve.Symbol.Size = 12;
// Fill the axis background with a gradient
myPane.Chart.Fill = new Fill(Color.White, Color.FromArgb(255, Color.ForestGreen), 45.0F);
// Offset Y space between point and label
// NOTE: This offset is in Y scale units, so it depends on your actual data
const double offset = 1.0;
// Loop to add text labels to the points
for (int i = 0; i < y.Length; i++)
{
// Get the pointpair
PointPair pt = curve.Points[i];
// Create a text label from the Y data value
TextObj text = new TextObj(pt.Y.ToString(""), pt.X, pt.Y + offset, CoordType.AxisXYScale, AlignH.Left, AlignV.Center);
text.ZOrder = ZOrder.A_InFront;
// Hide the border and the fill
text.FontSpec.Border.IsVisible = false;
text.FontSpec.Fill.IsVisible = false;
//text.FontSpec.Fill = new Fill( Color.FromArgb( 100, Color.White ) );
// Rotate the text to 90 degrees
text.FontSpec.Angle = 60; //字体倾斜度
myPane.GraphObjList.Add(text);
}
myPane.BarSettings.Type = BarType.SortedOverlay;
// Leave some extra space on top for the labels to fit within the chart rect
//myPane.YAxis.Scale.MaxGrace = 0.2;
myPane.XAxis.Type = AxisType.Text;
myPane.XAxis.Scale.TextLabels = x;
myPane.XAxis.Scale.FontSpec.Size = 13; //x线字体
myPane.XAxis.Scale.FontSpec.Angle = 60;//x线字体倾斜度
// Calculate the Axis Scale Ranges
zgc.AxisChange();
这个红色标记部分,就是循环获取每个点的值,代码没错啊,就是实际效果图死活不显示,为什么啊???


 发帖
发帖 与我相关
与我相关 我的任务
我的任务
 分享
分享


