

111,131
社区成员
 发帖
发帖 与我相关
与我相关 我的任务
我的任务
 分享
分享


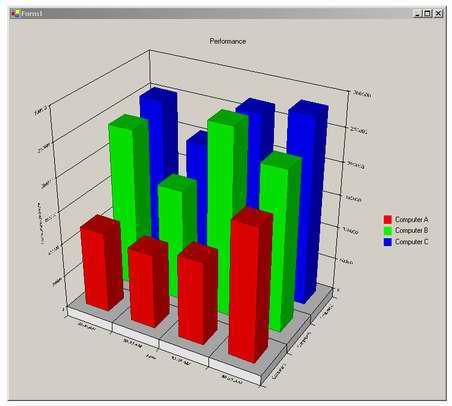 // Create chart data for three computers. Data is in the form of number of transactions per minute.
// We will only display data gathered between 10:00 AM and 10:03 AM.
axMSChart.ChartData = new Object[5, 4] {{null, "Computer A", "Computer B", "Computer C"},
{"10:00 AM", 123131, 242142, 254353},
{"10:01 AM", 113121, 171345, 205432},
{"10:02 AM", 126323, 281876, 269743},
{"10:03 AM", 199833, 242122, 283445}};
// Add a title and legend on the right side of the chart.
axMSChart.Title.Text = "Performance";
axMSChart.Legend.Location.LocationType = MSChart20Lib.VtChLocationType.VtChLocationTypeRight;
axMSChart.Legend.Location.Visible = true;
// Add titles to the axes.
axMSChart.Plot.get_Axis(MSChart20Lib.VtChAxisId.VtChAxisIdX, null).AxisTitle.Text = "Time";
axMSChart.Plot.get_Axis(MSChart20Lib.VtChAxisId.VtChAxisIdY, null).AxisTitle.Text = "Transactions/minute";
// Set chart type.
axMSChart.chartType = MSChart20Lib.VtChChartType.VtChChartType3dBar;
// Other available chart types are
// VtChChartType2dBar, VtChChartType3dLine, VtChChartType2dLine, VtChChartType3dArea,
// VtChChartType2dArea, VtChChartType3dStep, VtChChartType2dStep,
// VtChChartType3dCombination, VtChChartType2dCombination, VtChChartType2dPie and
// VtChChartType2dXY.
// Set whether all the series in the chart are stacked or not.
axMSChart.Stacking = false;
// Create chart data for three computers. Data is in the form of number of transactions per minute.
// We will only display data gathered between 10:00 AM and 10:03 AM.
axMSChart.ChartData = new Object[5, 4] {{null, "Computer A", "Computer B", "Computer C"},
{"10:00 AM", 123131, 242142, 254353},
{"10:01 AM", 113121, 171345, 205432},
{"10:02 AM", 126323, 281876, 269743},
{"10:03 AM", 199833, 242122, 283445}};
// Add a title and legend on the right side of the chart.
axMSChart.Title.Text = "Performance";
axMSChart.Legend.Location.LocationType = MSChart20Lib.VtChLocationType.VtChLocationTypeRight;
axMSChart.Legend.Location.Visible = true;
// Add titles to the axes.
axMSChart.Plot.get_Axis(MSChart20Lib.VtChAxisId.VtChAxisIdX, null).AxisTitle.Text = "Time";
axMSChart.Plot.get_Axis(MSChart20Lib.VtChAxisId.VtChAxisIdY, null).AxisTitle.Text = "Transactions/minute";
// Set chart type.
axMSChart.chartType = MSChart20Lib.VtChChartType.VtChChartType3dBar;
// Other available chart types are
// VtChChartType2dBar, VtChChartType3dLine, VtChChartType2dLine, VtChChartType3dArea,
// VtChChartType2dArea, VtChChartType3dStep, VtChChartType2dStep,
// VtChChartType3dCombination, VtChChartType2dCombination, VtChChartType2dPie and
// VtChChartType2dXY.
// Set whether all the series in the chart are stacked or not.
axMSChart.Stacking = false;


