62,046
社区成员
 发帖
发帖 与我相关
与我相关 我的任务
我的任务
 分享
分享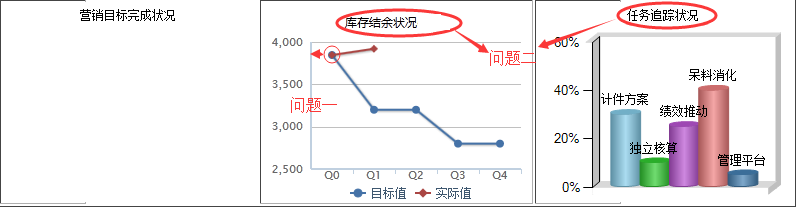
var chart; //定义Chart
$(function () {
chart = new Highcharts.Chart({
chart: {
renderTo: 'chart_line', //图表放置的容器,DIV
defaultSeriesType: 'line', //图表类型line(折线图),
zoomType: 'x' //x轴方向可以缩放
},
credits: {
enabled: false //右下角不显示LOGO
},
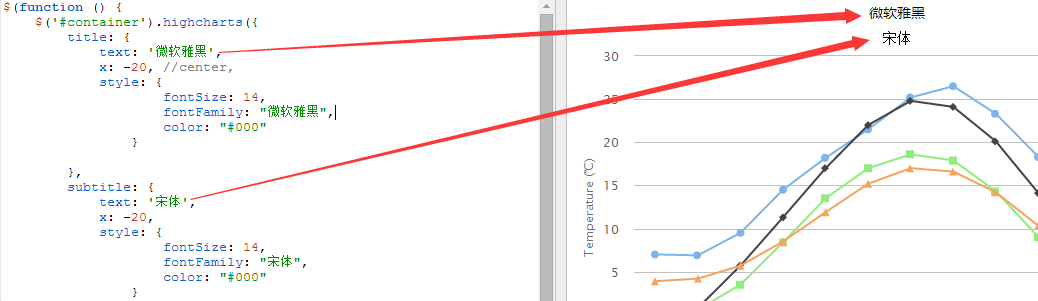
title: {
text: '库存结余状况', //图表标题
style: {
fontSize: 14,
fontFamily: "微软雅黑",
color: "#000"
}
},
xAxis: { //x轴
categories: ['Q0', 'Q1', 'Q2', 'Q3', 'Q4'], //x轴标签名称
gridLineWidth: 0, //设置网格宽度为1
lineWidth: 2, //基线宽度
labels: { y: 10} //x轴标签位置:距X轴下方26像素
},
yAxis: { //y轴
title: false, //标题
lineWidth: 2 //基线宽度
},
plotOptions: { //设置数据点
line: {
dataLabels: {
enabled: false //在数据点上显示对应的数据值
},
enableMouseTracking: true //取消鼠标滑向触发提示框
}
},
legend: { //图例
layout: 'horizontal', //图例显示的样式:水平(horizontal)/垂直(vertical)
// backgroundColor: '#ffc', //图例背景色
align: 'center', //图例水平对齐方式
verticalAlign: 'bottom', //图例垂直对齐方式
borderWidth: 0, //边框为0
x: 10, //相对X位移
y: 8, //相对Y位移
floating: true //设置可浮动
// shadow: true //设置阴影
},
exporting: {
enabled: false //设置导出按钮不可用
},
series: [
{ //数据列
name: '目标值',
data: [3847, 3200, 3200, 2800, 2800]
},
{
name: '实际值',
data: [3847, 3921]
}]
});
});