系统维护与使用区

安装gdb的时候报错,make[1] leaving directory和make error 2
 墨衍会员 · AI 创作全网分发 墨衍智能分发 通过墨衍一键同步至各平台 可同步平台 CSDN微信公众号微博知乎掘金百家号博客园抖音小红书 你的文章也可以这样分发 墨衍会员 ¥399起/年,写一次发全网
我也要 关注 + 加入社区
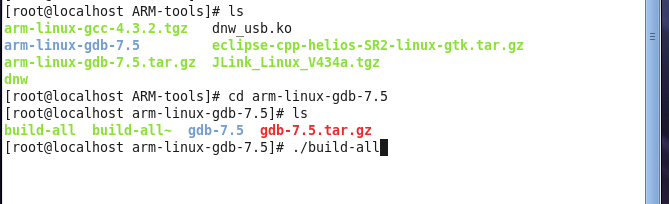
先是解压了那个arm-linux-gdb-7.5的包, 然后就进去执行了./build-all
执行完了之后如下图
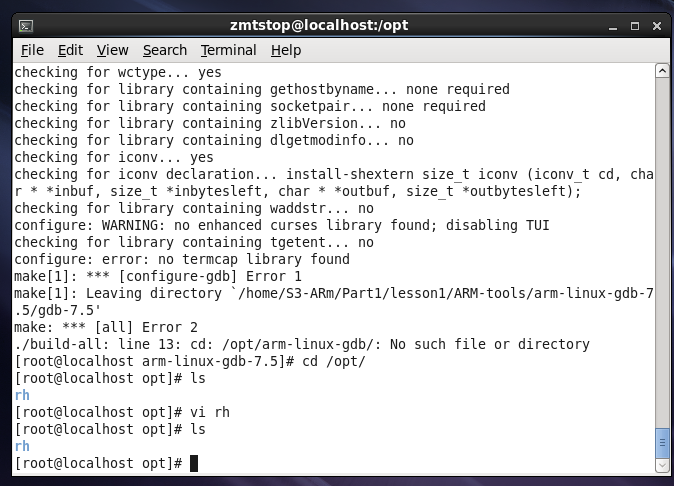
就出现我题目中提及的错误.
我是新手啊,这个实在是,搞不懂..我还尝试建了个arm-linux-gdb的目录在/opt/里面,然后重新执行./build-all,发现报的错误都还是一模一样的
买的板子是TQ2440,这些包都是资料里就有的
相关推荐
romfs.2.0.x.gz
uClinux in the GDB/ARMulator Here are some patches to GDB to allow the existing gdb ARM emulator to run uClinux targets. It can run both little-endian and big-endian code, as well as apcs-32/26 code and Thumb. I have tested little/big endian kernels but haven't played with thumb at this point. The patch is heavily based on an ARM7100 patch that Ben Williamson produced back around 1999 for gdb-4.18. The changes include Atmel AT91 emulation for timers/system registers and serial ports, removal of Bens LCD support and porting to gdb-5.0. News Dec 2002 Many thanks to Yu Chen who has sent in build instructions for Cygwin targets. He has also provided precompiled binaries that can be extracted from "/". Nov 2002 Fernando José Cardozo de Sá has been kind enough to send in his Win32 native port of the ARMulator. All the files needed are in the Win32 directory. The Win32 binaries work just like the unix versions, check the section below on Running the precompiled binaries. Fixed the 'ls'/'ps' problem with big-endian targets by stealing a small bit of the patch provided by Daniel Versick's (http://mac.os.nctu.edu.tw/distfiles/4530.patch). More of this patch may be required I just haven't had time to digest it all. Jan 2006 Wow an update :-) Needed to implement the IPR (Interrupt Pending Register) in order to work with a bug fix pending for the 2.4.x kernel. Mar 2007 Here's a patch to fix problems compiling the armulator on newer systems (invalid lvalue error). What you get Here are some files you can use to put together uClinux running in the GDB/ARMulator. gdb-5.0.tar.bz2 The orginal gdb-5.0 archive. gdb-5.0-uclinux-armulator-20060104.patch.gz Patches against gdb-5.0 based heavily on the ARMulator changes from Ben Williamson <benw@pobox.com> with changes to behave like an Atmel AT91 device. uClinux-dist-20020927.patch.gz The changes you will need to fix GDB/ARMulator-BE support in the 20020927 distro, specifically 'ps' and 'ls'. Big endian support is not as stable as the little endian GDB/ARMulator target and is only recommended if you really want to play with a big-endian system. uClinux-20020701-20020816.patch.gz The changes you will need to make XIP (execute in place) and big-endian targets work with the 20020701 distro. Choose the GDB/ARMulator-EB to build big-endian kernels and apps. Choose GDB/ARMulator for little endian targets. linux.2.0.x.gz linux.2.4.x.gz A precompiled uClinux kernel binaries that you can run in the emulator. romfs.2.0.x.gz romfs.2.4.x.gz romfs images to use with the above kernels. linux.2.0.x-xip.gz linux.2.4.x-xip.gz A precompiled uClinux kernel binaries with XIP support that you can run in the emulator. romfs.2.0.x-xip.gz romfs.2.4.x-xip.gz romfs images to use with the above kernels. Applications are XIP. example-session.txt An example session in the debugger. Building the Debugger/Emulator bunzip2 < gdb-5.0.tar.bz2 | tar xvf - gunzip < gdb-5.0-uclinux-armulator-20060104.patch.gz | patch -p0 cd gdb-5.0 ./configure --target=arm-elf make su root -c "make install" Running the precompiled binaries The ARMulator expects the romfs to be in a file called "boot.rom". You must use the matching kernel/romfs combo's. gunzip romfs.2.0.x gunzip linux.2.0.x ln -s romfs.2.0.x boot.rom arm-elf-gdb linux-2.0.x ... gdb> target sim ... gdb> load ... gdb> run And likewise for 2.4, just change the names. Checkout the example-session.txt file to see what it looks like. Using the Debugger Just type ^C to drop into gdb. There are no symbols in the binaries provided above, but if you build your own your will have full source debugging of the kernel (and apps if you load their symbols appropriately). You can step and continue just like a normal debugger. Building from Source If you are using an older uClinux distro, just apply the patch and see how you go. Anything more recent than the patches mention will include the GDB/ARMulator target by default with the patches included. You can get the source from: http://www.uclinux.org/pub/uClinux/dist/ Be sure to check for any patches above that are required for the version you download. You can get the tools from: http://www.uclinux.org/pub/uClinux/arm-elf-tools/ Build as for any other target, the images above were built with uC-libc. When building from source, create a file in the top directory called ".gdbinit" that contains: target sim load to save some typing ;-) Then link the romfs.img to boot.rom with: ln -s images/romfs.img boot.rom and run arm-elf-gdb linux-2.X.X/linux to have full source debug of the kernel and friends. Messing with the Emulator If you want to see how much of a hack this really is, the main files to look at are: gdb-5.0/sim/arm/armmem.c gdb-5.0/sim/arm/armio.c These still include the old 7100 code commented out and the Atmel emulation that is truly hacked in on top. You can add more memory and change the size of the rom in armmem.c. You can fix most bugs in the emulation in armio.c. Thanks to Patrick Doyle for the time.h patch to fixcompiling on RedHat 7.2/7.3 Fernando José Cardozo de Sá for his Native 32 port (and binaries). Daniel Versick's big-endian patches for uaccess (taken from http://mac.os.nctu.edu.tw/distfiles/4530.patch). Copyright (C) 2002,2005 David McCullough <davidm@snapgear.com>
Springer.The.Developer’s.Guide.to.Debugging.2008.pdf
1 You Write Software; You have Bugs . . . . . . . . . 1 2 A Systematic Approach to Debugging . . . . . . . 5 2.1 Why Follow a Structured Process? . . . . . . . 5 2.2 Making the Most of Your Opportunities . . . . . . 5 2.3 13 Golden Rules . . . . . . . . . . . . . 7 2.3.1 Understand the Requirements . . . . . . 8 2.3.2 Make it Fail . . . . . . . . . . . . 8 2.3.3 Simplify the Test Case . . . . . . . . . 9 2.3.4 Read the Right Error Message . . . . . . 9 2.3.5 Check the Plug . . . . . . . . . 9 2.3.6 Separate Facts from Interpretation . . . . . 10 2.3.7 Divide and Conquer . . . . . . . . 10 2.3.8 Match the Tool to the Bug . . . . . . . . . 12 2.3.9 One Change at a Time . . . . . . . . . 12 2.3.10 Keep an Audit Trail . . . . . . . . 12 2.3.11 Get a Fresh View . . . . . . . . . . . 13 2.3.12 If You Didn’t Fix it, it Ain’t Fixed . . . . . 13 2.3.13 Cover your Bugfix with a Regression Test . . . . . 13 2.4 Build a Good Toolkit . . . . . . . . . . . . 14 2.4.1 Your Workshop . . . . . . . . . 15 2.4.2 Running Tests Every Day Keeps the Bugs at Bay . . 15 2.5 Know Your Enemy – Meet the Bug Family . . . . . . 17 2.5.1 The Common Bug . . . . . . . . . . 17 2.5.2 Sporadic Bugs . . . . . . . . . . 18 2.5.3 Heisenbugs. . . . . . . . . . 18 2.5.4 Bugs Hiding Behind Bugs . . . . . . . . . 19 2.5.5 Secret Bugs – Debugging and Confidentiality . . . . . 20 2.5.6 Further Reading . . . . . . . . . 21 3 Getting to the Root – Source Code Debuggers . . . . . . 23 3.1 Visualizing Program Behavior . . . . . . . . 23 3.2 Prepare a Simple Predictable Example . . . . . . . 24 3.3 Get the Debugger to Run with Your Program . . . . . . . 24 3.4 Learn to do a Stack Trace on a Program Crash . . . . . . 27 3.5 Learn to Use Breakpoints . . . . . . . . . 28 3.6 Learn to Navigate Through the Program. . . . . . 28 3.7 Learn to Inspect Data: Variables and Expressions . . . . 29 3.8 A Debug Session on a Simple Example . . . . . . 30 4 Fixing Memory Problems . . . . . . . . . . . . 33 4.1 Memory Management in C/C++ – Powerful but Dangerous . . . . 33 4.1.1 Memory Leaks . . . . . . . . . 34 4.1.2 Incorrect Use of Memory Management . . . . 34 4.1.3 Buffer Overruns . . . . . . . . . . . 34 4.1.4 Uninitialized Memory Bugs . . . . . . . . 34 4.2 Memory Debuggers to the Rescue . . . . . . . . 35 4.3 Example 1: Detecting Memory Access Errors . . . . . . . 36 4.3.1 Detecting an Invalid Write Access . . . . . 36 4.3.2 Detecting Uninitialized Memory Reads . . . . 37 4.3.3 Detecting Memory Leaks . . . . . . . 38 4.4 Example 2: Broken Calls to Memory Allocation/Deallocation . . 38 4.5 Combining Memory and Source Code Debuggers . . . . . . 40 4.6 Cutting Down the Noise – Suppressing Errors . . . . . . . 40 4.7 When to Use a Memory Debugger . . . . . . . 41 4.8 Restrictions . . . . . . . . . . . . . . 42 4.8.1 Prepare Test Cases with Good Code Coverage . . . . 42 4.8.2 Provide Additional Computer Resources . . . . . . 42 4.8.3 Multi-Threading May Not be Supported . . . . . . 42 4.8.4 Support for Non-standard Memory Handlers . . . 42 5 Profiling Memory Use . . . . . . . . . . . . 45 5.1 Basic Strategy – The First Steps . . . . . . . . . 45 5.2 Example 1: Allocating Arrays . . . . . . . . 46 5.3 Step 1: Look for Leaks . . . . . . . . . . . 46 5.4 Step 2: Set Your Expectations . . . . . . . . 47 5.5 Step 3: Measure Memory Consumption . . . . . . 47 5.5.1 Use Multiple Inputs . . . . . . . . 48 5.5.2 Stopping the Program at Regular Intervals . . . . . 48 5.5.3 Measuring Memory Consumption with Simple Tools . . 49 5.5.4 Use top . . . . . . . . . . . . 49 5.5.5 Use the Windows Task Manager . . . . . . . 50 5.5.6 Select Relevant Input Values for testmalloc . . . 51 5.5.7 Determine how Memory is Deallocated on Your Machine . 51 5.5.8 Use a Memory Profiler . . . . . . . . . 53 5.6 Step 4: Identifying Greedy Data Structures . . . . . . 54 5.6.1 Instrumenting Data Structures . . . . . . 55 5.7 Putting it Together – The genindex Example. . . . . . 55 5.7.1 Check that There are No Major Leaks . . . . . 56 5.7.2 Estimate the Expected Memory Use . . . . . . . 56 5.7.3 Measure Memory Consumption . . . . . . . 57 5.7.4 Find the Data Structures that Consume Memory . . . 57 6 Solving Performance Problems . . . . . . . . . . 63 6.1 Finding Performance Bugs – A Step-by-Step Approach . . . . . 63 6.1.1 Do an Upfront Analysis . . . . . . . . 64 6.1.2 Use a Simple Method of Measuring Time . . . . . 64 6.1.3 Create a Test Case . . . . . . . . . . 65 6.1.4 Make the Test Case Reproducible . . . . . . 65 6.1.5 Check the Program for Correctness . . . . . . . 66 6.1.6 Make the Test Case Scalable . . . . . . . 66 6.1.7 Isolate the Test Case from Side Effects . . . . 67 6.1.8 Measurement with time can have Errors and Variations . 68 6.1.9 Select a Test Case that Exposes the Runtime Bottleneck . . 68 6.1.10 The Difference Between Algorithm and Implementation . . 70 6.2 Using Profiling Tools . . . . . . . . . . . . 72 6.2.1 Do Not Write Your Own Profiler . . . . . . . 72 6.2.2 How Profilers Work . . . . . . . . 73 6.2.3 Familiarize Yourself with gprof . . . . . . 74 6.2.4 Familiarize Yourself with Quantify . . . . . 79 6.2.5 Familiarize Yourself with Callgrind . . . . . . . 81 6.2.6 Familiarize Yourself with VTune . . . . . . 82 6.3 Analyzing I/O Performance . . . . . . . . . . 84 6.3.1 Do a Sanity Check of Your Measurements . . . . . 85 7 Debugging Parallel Programs . . . . . . . . . 87 7.1 Writing Parallel Programs in C/C++ . . . . . . . . . 87 7.2 Debugging Race Conditions . . . . . . . . . . 88 7.2.1 Using Basic Debugger Capabilities to Find Race Conditions . . . . . . . . . . 89 7.2.2 Using Log Files to Localize Race Conditions . . . . . 91 7.3 Debugging Deadlocks . . . . . . . . . . . . 93 7.3.1 How to Determine What the Current Thread is Executing . 94 7.3.2 Analyzing the Threads of the Program . . . . . 95 7.4 Familiarize Yourself with Threading Analysis Tools . . . . . 96 7.5 Asynchronous Events and Interrupt Handlers . . . . . . . 98 8 Finding Environment and Compiler Problems . . . . . . 101 8.1 Environment Changes – Where Problems Begin . . . . . 101 8.1.1 Environment Variables . . . . . . . . . 101 8.1.2 Local Installation Dependencies . . . . . . . 102 8.1.3 Current Working Directory Dependency . . . . . . 102 8.1.4 Process ID Dependency . . . . . . . . 102 8.2 How else to See what a Program is Doing . . . . . . . 103 8.2.1 Viewing Processes with top . . . . . . . 103 8.2.2 Finding Multiple Processes of an Application with ps . . . 103 8.2.3 Using /proc/<pid> to Access a Process . . . . 104 8.2.4 Use strace to Trace Calls to the OS . . . . . 104 8.3 Compilers and Debuggers have Bugs too . . . . . . . . 106 8.3.1 Compiler Bugs . . . . . . . . . 106 8.3.2 Debugger and Compiler Compatibility Problems . . 107 9 Dealing with Linking Problems . . . . . . . . . . 109 9.1 How a Linker Works . . . . . . . . . . 109 9.2 Building and Linking Objects . . . . . . . . 110 9.3 Resolving Undefined Symbols . . . . . . . . 111 9.3.1 Missing Linker Arguments . . . . . . . . 111 9.3.2 Searching for Missing Symbols . . . . . . . . 112 9.3.3 Linking Order Issues . . . . . . . . . . 113 9.3.4 C++ Symbols and Name Mangling . . . . . 114 9.3.5 Demangling of Symbols . . . . . . . . 115 9.3.6 Linking C and C++ Code . . . . . . . 115 9.4 Symbols with Multiple Definitions . . . . . . . 116 9.5 Symbol Clashes . . . . . . . . . . . 117 9.6 Identifying Compiler and Linker Version Mismatches . . . 118 9.6.1 Mismatching System Libraries . . . . . . . . 119 9.6.2 Mismatching Object Files . . . . . . . . . 119 9.6.3 Runtime Crashes . . . . . . . . . . . 120 9.6.4 Determining the Compiler Version . . . . . 120 9.7 Solving Dynamic Linking Issues . . . . . . . . . 122 9.7.1 Linking or Loading DLLs . . . . . . . . . 122 9.7.2 DLL Not Found . . . . . . . . . 124 9.7.3 Analyzing Loader Issues . . . . . . . 125 9.7.4 Setting Breakpoints in DLLs . . . . . . . 126 9.7.5 Provide Error Messages for DLL Issues . . . . 127 10 Advanced Debugging . . . . . . . . . . . . . 129 10.1 Setting Breakpoints in C++ Functions, Methods, and Operators . 129 10.2 Setting Breakpoints in Templatized Functions and C++ Classes . 131 10.3 Stepping in C++ Methods . . . . . . . . . 133 10.3.1 Stepping into Implicit Functions . . . . . . . 134 10.3.2 Skipping Implicit Functions with the Step-out Command . 135 10.3.3 Skipping Implicit Functions with a Temporary Breakpoint 136 10.3.4 Returning from Implicit Function Calls . . . . 136 10.4 Conditional Breakpoints and Breakpoint Commands . . . . 137 10.5 Debugging Static Constructor/Destructor Problems . . . . . 140 10.5.1 Bugs Due to Order-Dependence of Static Initializers . . 140 10.5.2 Recognizing the Stack Trace of Static Initializers . . 141 10.5.3 Attaching the Debugger Before Static Initialization . . . 142 10.6 Using Watchpoints . . . . . . . . . . . 143 10.7 Catching Signals . . . . . . . . . . . . . 144 10.8 Catching Exceptions . . . . . . . . . . 147 10.9 Reading Stack Traces . . . . . . . . . . . . 148 10.9.1 Stack Trace of Source Code Compiled with Debug Information . . . . . . . . 148 10.9.2 Stack Trace of Source Code Compiled Without Debug Information . . . . . . . . 149 10.9.3 Frames Without Any Debug Information . . . . . . 149 10.9.4 Real-Life Stack Traces . . . . . . . . . 150 10.9.5 Mangled Function Names . . . . . . . . . 151 10.9.6 Broken Stack Traces . . . . . . . . 151 10.9.7 Core Dumps . . . . . . . . . . . . 152 10.10 Manipulating a Running Program . . . . . . . . 153 10.10.1 Changing a Variable . . . . . . . . 156 10.10.2 Calling Functions . . . . . . . . . . 156 10.10.3 Changing the Return Value of a Function . . . . . . 157 10.10.4 Aborting Function Calls . . . . . . . . 157 10.10.5 Skipping or Repeating Individual Statements . . . . . 158 10.10.6 Printing and Modifying Memory Content . . . . . 159 10.11Debugging Without Debug Information . . . . . . 161 10.11.1 Reading Function Arguments From the Stack . . . . . 163 10.11.2 Reading Local/Global Variables, User-Defined Data Types 165 10.11.3 Finding the Approximate Statement in the Source Code . . 165 10.11.4 Stepping Through Assembly Code . . . . . 166 11 Writing Debuggable Code . . . . . . . . . . . . 169 11.1 Why Comments Count . . . . . . . . . . . 169 11.1.1 Comments on Function Signatures . . . . . 170 11.1.2 Comments on Workarounds . . . . . . . . 171 11.1.3 Comments in Case of Doubt . . . . . . . 171 11.2 Adopting a Consistent Programming Style . . . . . . 171 11.2.1 Choose Names Carefully . . . . . . . 171 11.2.2 Avoid Insanely Clever Constructs . . . . . . 172 11.2.3 Spread Out Your Code . . . . . . . . . 172 11.2.4 Use Temporary Variables for Complex Expressions . . . 172 11.3 Avoiding Preprocessor Macros . . . . . . . . . . 173 11.3.1 Use Constants or Enums Instead of Macros . . . . 173 11.3.2 Use Functions Instead of Preprocessor Macros . . . . 175 11.3.3 Debug the Preprocessor Output . . . . . . . . 176 11.3.4 Consider Using More Powerful Preprocessors . . . . 177 11.4 Providing Additional Debugging Functions . . . . . . 179 11.4.1 Displaying User-Defined Data Types . . . . . . 179 11.4.2 Self-Checking Code . . . . . . . . 180 11.4.3 Debug Helpers for Operators . . . . . . . 181 11.5 Prepare for Post-Processing . . . . . . . . . . 181 11.5.1 Generate Log Files . . . . . . . . . 181 12 How Static Checking Can Help . . . . . . . . . . 183 12.1 Using Compilers as Debugging Tools . . . . . . . . 183 12.1.1 Do not Assume Warnings to be Harmless . . . . . 184 12.1.2 Use Multiple Compilers to Check the Code . . . . 186 12.2 Using lint . . . . . . . . . . . . . . 186 12.3 Using Static Analysis Tools . . . . . . . . . . 187 12.3.1 Familiarize Yourself with a Static Checker . . . . 187 12.3.2 Reduce Static Checker Errors to (Almost) Zero . . . 189 12.3.3 Rerun All Test Cases After a Code Cleanup . . . 190 12.4 Beyond Static Analysis . . . . . . . . . . . 190 13 Summary . . . . . . . . . . . . . . 191 A Debugger Commands . . . . . . . . . . . . . 193 B Access to Tools . . . . . . . . . . . . . 195 B.1 IDEs, Compilers, Build Tools . . . . . . . . 195 B.1.1 Microsoft Visual Studio . . . . . . . . 195 B.1.2 Eclipse . . . . . . . . . . . . . 196 B.1.3 GCC . . . . . . . . . . . . 196 B.1.4 GNU Make . . . . . . . . . . . . 196 B.2 Debuggers . . . . . . . . . . . . 196 B.2.1 dbx . . . . . . . . . . . . . 196 B.2.2 DDD . . . . . . . . . . . . 197 B.2.3 GDB . . . . . . . . . . . . 197 B.2.4 ARM RealView . . . . . . . . . 197 B.2.5 TotalView Debugger . . . . . . . . 197 B.2.6 Lauterbach TRACE32 . . . . . . . . . 197 B.3 Environments . . . . . . . . . . . . . 198 B.3.1 Cygwin . . . . . . . . . . . . . 198 B.3.2 VMware . . . . . . . . . . . . 198 B.4 Memory Debuggers . . . . . . . . . . . 198 B.4.1 Purify . . . . . . . . . . . 198 B.4.2 Valgrind . . . . . . . . . . . . 199 B.4.3 KCachegrind . . . . . . . . . . . 199 B.4.4 Insure++ . . . . . . . . . . . . 199 B.4.5 BoundsChecker . . . . . . . . . 200 B.5 Profilers . . . . . . . . . . . . . . 200 B.5.1 gprof . . . . . . . . . . . . 200 B.5.2 Quantify . . . . . . . . . . . . 200 B.5.3 Intel VTune . . . . . . . . . . . . 200 B.5.4 AQtime . . . . . . . . . . . . . 201 B.5.5 mpatrol . . . . . . . . . . . . . 201 B.6 Static Checkers . . . . . . . . . . . 201 B.6.1 Coverity . . . . . . . . . . . . 201 B.6.2 Lint . . . . . . . . . . . . . 201 B.6.3 Splint . . . . . . . . . . . 202 B.6.4 /analyze option in Visual Studio Enterprise Versions . . 202 B.6.5 Klocwork . . . . . . . . . . . 202 B.6.6 Fortify . . . . . . . . . . . . . 202 B.6.7 PC-lint/FlexeLint . . . . . . . . . . 203 B.6.8 QA C++ . . . . . . . . . . . . 203 B.6.9 Codecheck . . . . . . . . . . 203 B.6.10 Axivion Bauhaus Suite . . . . . . . . . 203 B.6.11 C++ SoftBench CodeAdvisor . . . . . . 203 B.6.12 Parasoft C++test . . . . . . . . . . . 204 B.6.13 LDRA tool suite . . . . . . . . . . . 204 B.6.14 Understand C++ . . . . . . . . . . . 204 B.7 Tools for Parallel Programming . . . . . . . . . . 204 B.7.1 Posix Threads . . . . . . . . . . 204 B.7.2 OpenMP . . . . . . . . . . . . 204 B.7.3 Intel TBB . . . . . . . . . . . 205 B.7.4 MPI . . . . . . . . . . . . . 205 B.7.5 MapReduce . . . . . . . . . . . . 205 B.7.6 Intel Threading Analysis Tools . . . . . . . . 205 B.8 Miscellaneous Tools . . . . . . . . . . 206 B.8.1 GNU Binutils . . . . . . . . . . . 206 B.8.2 m4 . . . . . . . . . . . . . . 206 B.8.3 ps . . . . . . . . . . . . . . 206 B.8.4 strace / truss . . . . . . . . . . 207 B.8.5 top. . . . . . . . . . . . . 207 B.8.6 VNC . . . . . . . . . . . . 207 B.8.7 WebEx . . . . . . . . . . . . . 207 C Source Code . . . . . . . . . . . . . . . 209 C.1 testmalloc.c . . . . . . . . . . . . . . 209 C.2 genindex.c . . . . . . . . . . . . 210 C.3 isort.c . . . . . . . . . . . . . 214 C.4 filebug.c . . . . . . . . . . . . . . 216 References . . . . . . . . . . . . . . 217 Index . . . . . . . . . . . . . . . . 219
Linux系统升级及内核版本升级
一、背景 工作中有时会遇到系统版本过旧,无法满足安全扫描后的安全要求,系统漏洞数量多,处理难度较大,这时,我们就需要升级OS或Linux内核版本; 二、升级操作 2.1、 redhat/CentOS系统 三、附录:包升级命令 1)配置yum更新源 /etc/yum.repos.d目录下新建主机的yum源,.repos文件中,repositoryid:指定一个仓库,name指定仓库名称, baseurl:指定仓库的URL,mirrorlist指定仓库的镜像站点,enable是否启用本仓库,gpgcheck
三相PWM整流器双闭环仿真(Simulink仿真实现)
内容概要:本文系统介绍了基于Simulink的三相PWM整流器双闭环控制系统的仿真实现方法,重点对比了模糊PID控制与传统PID控制在电力电子系统中的动态性能差异,涵盖系统建模、控制器设计、仿真搭建与结果分析等关键环节。同时拓展提供了丰富的科研仿真资源,覆盖无刷直流电机控制、智能优化算法、机器学习、图像处理、路径规划、通信与信号处理、电力系统管理等多个技术方向,形成面向科研与工程应用的综合性Matlab/Simulink仿真支持体系。; 适合人群:电气工程、自动化、控制科学与工程等相关专业的研究生及科研人员,具备一定Matlab/Simulink操作基础,正在开展电力电子变换、电机驱动控制或智能控制算法研究的技术工作者。; 使用场景及目标:①掌握三相PWM整流器双闭环系统的建模与仿真流程;②深入理解模糊PID相对于传统PID在抗扰动、响应速度和稳定性方面的优势;③借鉴文中提供的多样化仿真案例,推动智能算法在复杂系统控制中的创新应用与科研成果转化。; 阅读建议:建议结合文档中提供的网盘资源与公众号资料,按照目录结构循序渐进地学习各仿真模型的设计思路与实现细节,动手复现并调试代码,强化对控制策略本质与系统动态特性的理解,提升科研仿真能力。
WeVisOne-VL一套模型,把检测、分割、抠图和OCR都接到了一起
WeVisOne-VL 想解决的不是单点能力更强,而是把目标级理解和像素级理解放进同一套视觉语言模型里:从点、框,到 mask,再到连续 alpha matte,都能统一生成。 它覆盖检测、指代表达定位、计数、点选、OCR、分割和抠图,最大的看点是输出粒度可以按需求切换,而且遇到图里根本不存在的目标时,能直接返回 None,尽量避免“看错了还硬答”的幻觉。 技术上,它把任务统一写成结构化文本预测,再配一个只有 960 万参数的轻量像素解码器,不依赖 SAM,也能把框进一步细化成 mask 和 alpha matte。项目同时放出了 2B、4B 权重、推理包、Cookbooks、评测流程和 Gradio Demo;按仓库给出的结果,4B 版本在检测、指代定位、计数、OCR、分割和抠图等多项基准上都压过一批强开源基线。 更值得琢磨的是它背后的数据引擎:用知识图谱驱动概念发现,再结合专家模型与 VLM 校验,把框扩展到 mask 和高质量透明度标注,累计覆盖超过 1 亿张图像。这类工作真正有价值的地方,不只是又做出一个大模型,而是让“看见什么”和“精确到哪一层”第一次被放进一条顺滑的产品链路里。