62,269
社区成员
 发帖
发帖 与我相关
与我相关 我的任务
我的任务
 分享
分享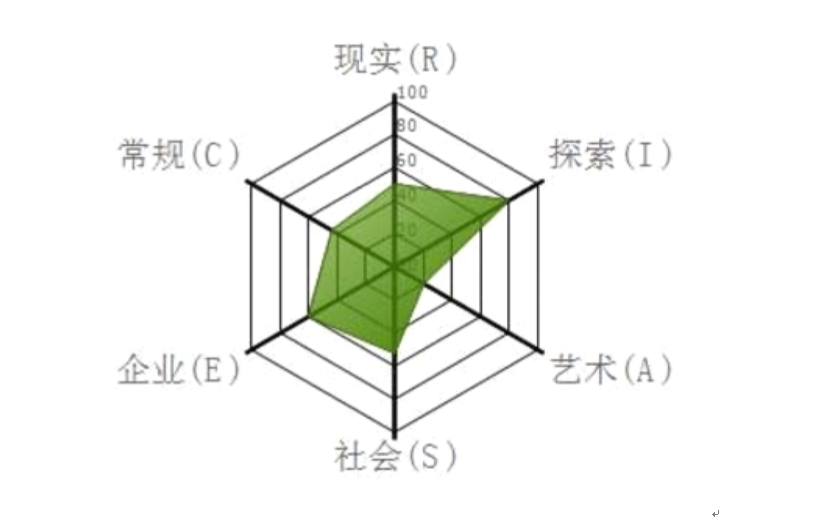
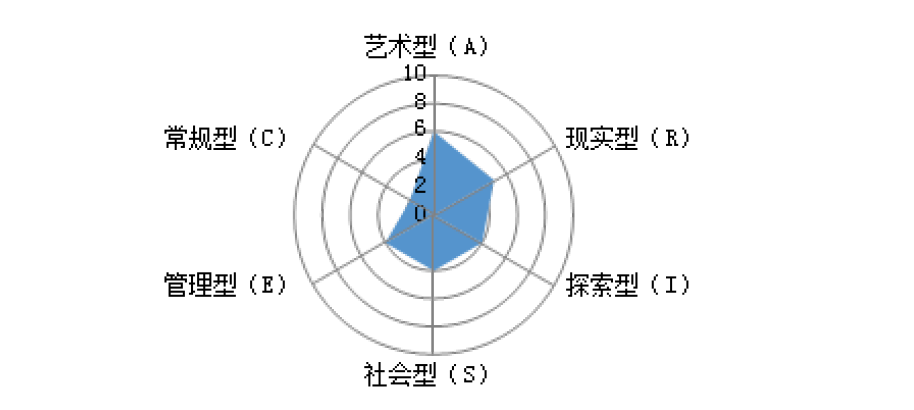
 public iTextSharp.text.Image GetRadarGraph(int width, int height, string series1, double[] yValues1, string[] xValues)

        {

            Chart chart = new Chart();

            chart.Width = width;

            chart.Height = height;

            chart.BackColor = Color.Transparent;


            ChartArea ca = new ChartArea("ChartArea");

            chart.ChartAreas.Add(ca);

            ca.BackColor = Color.Transparent;


            Axis ay = ca.AxisY;

            ay.Maximum = 10;

            ca.AxisX.MajorGrid.Enabled = false;

            ca.AxisY.MajorGrid.Enabled = false;

            ca.AxisX.Interval = 1;

            ca.AxisX.IntervalOffset = 1; //设置 1 是为当 X 轴的信息超过 10 个时显示全部信息

            ca.AxisX.LabelStyle.Font = new Font(new FontFamily("宋体"), 9, FontStyle.Regular);

            ca.AxisX.LineWidth = 1;

            ca.AxisX.LineColor = Color.FromArgb(128, 128, 128);


            ca.AxisY.LabelStyle.Font = new Font(new FontFamily("宋体"), 9, FontStyle.Regular);

            ca.AxisY.LineWidth = 1;

            ca.AxisY.LineColor = Color.FromArgb(128, 128, 128);

            ca.AxisY.MajorTickMark.TickMarkStyle = TickMarkStyle.None;

            //ca.AxisY.LabelStyle.Angle = 90;


            ca.AxisY2.LabelStyle.Font = new Font(new FontFamily("宋体"), 9, FontStyle.Regular);

            ca.AxisY2.LineWidth = 1;

            ca.AxisY2.LineColor = Color.FromArgb(128, 128, 128);


           Series se1ay = new Series("低等");


            se1ay.ChartType = SeriesChartType.Radar;


            se1ay.Color = Color.White;


            //设置区域背景样式

           // se1ay.BackHatchStyle = ChartHatchStyle.DottedDiamond;


            se1ay.YAxisType = AxisType.Primary;


            se1ay.MarkerBorderWidth = 1;

            se1ay.MarkerBorderColor = Color.Black;


            se1ay.IsVisibleInLegend = false;


            se1ay.CustomProperties = "PixelPointWidth=18"; //设置宽度


            for (int i = yValues1.Length - 1; i >= 0; i--)

            {

                se1ay.Points.AddXY(xValues[i], ay.Maximum);

            }


            chart.Series.Add(se1ay);


            //个人得分====================================================================

            Series se1ay2 = new Series(series1);

            se1ay2.ChartType = SeriesChartType.Radar;

            se1ay2.Color = Color.FromArgb(121, 165, 66);

            se1ay2.CustomProperties = "PixelPointWidth=4"; //设置宽度

            se1ay2.IsVisibleInLegend = false;

            se1ay2.MarkerStyle = MarkerStyle.None;

            se1ay2.MarkerSize = 6;


            for (int i = yValues1.Length - 1; i >= 0; i--)

            {

                se1ay2.Points.AddXY(xValues[i], yValues1[i]);

            }

            chart.Series.Add(se1ay2);


            var returnStream = new MemoryStream();

            chart.ImageType = ChartImageType.Png;

            chart.SaveImage(returnStream);

            returnStream.Position = 0;


            iTextSharp.text.Image png = iTextSharp.text.Image.GetInstance(returnStream);


            return png;

        }
 如果这个属性可行,烦请告诉一下是哪个样式名称。所有样式地址贴在下面:

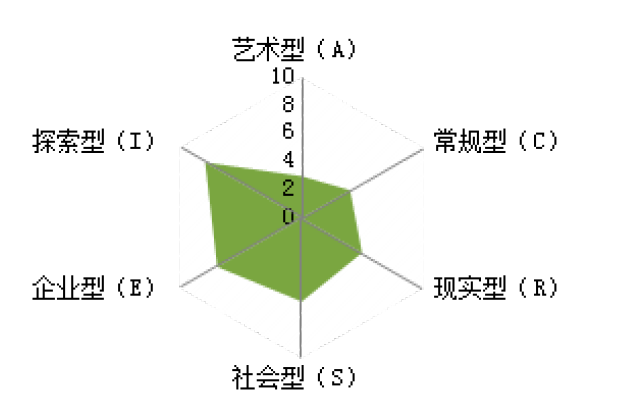
  #region 通用雷达图背景
        /// <summary>
        /// 通用雷达图背景
        /// </summary>
        /// <param name="width"></param>
        /// <param name="height"></param>
        /// <param name="len">边数</param>
        /// <param name="cd">对角线的长度</param>
        /// <param name="rotation">旋转角度</param>
        /// <returns></returns>
        public iTextSharp.text.Image GetTYRadarBackgroundImageGraph(int width, int height, int len, int cd, double rotation)
        {
            Bitmap bm = new Bitmap(width, height);
            SolidBrush barBrush1 = new SolidBrush(Color.Gray);
            SolidBrush barBrush2 = new SolidBrush(Color.FromArgb(0, 206, 209));

            Graphics g = Graphics.FromImage(bm);//画板
            g.SmoothingMode = SmoothingMode.AntiAlias;//抗锯齿
            g.TextRenderingHint = TextRenderingHint.AntiAlias;
            Font f = new Font("微软雅黑", 1);
            Pen p = new Pen(barBrush1, 0.1f);
            Pen p1 = new Pen(barBrush2, 2f);

            double val = rotation;//旋转度,如果为0则不旋转,从y轴为0开始

            try
            {

                //画同心多边形===========================================================================================
                for (int j = 1; j <= 5; j++)
                {
                    Point[] points1 = new Point[len + 1];
                    for (int i = 0; i < len; i++)
                    {
                        int x = (int)(width / 2 + cd / 5 * j * Math.Cos((double)2 * i * Math.PI / len + val*Math.PI/180));
                        int y = (int)(height / 2 - cd / 5 * j * Math.Sin((double)2 * i * Math.PI / len + val*Math.PI/180));
                        points1[i] = new Point(x, y);
                    }

                    points1[len] = new Point((int)(width / 2 + cd/5 * j * Math.Cos(Math.PI*val/180)), (int)(height / 2 - cd/5 * j * Math.Sin(Math.PI*val/180)));

                    g.DrawLines(p, points1);
                }


                iTextSharp.text.Image png = iTextSharp.text.Image.GetInstance(bm, ImageFormat.Png);

                return png;
            }
            finally
            {
                g.Dispose();
                bm.Dispose();
            }
        }

        #endregion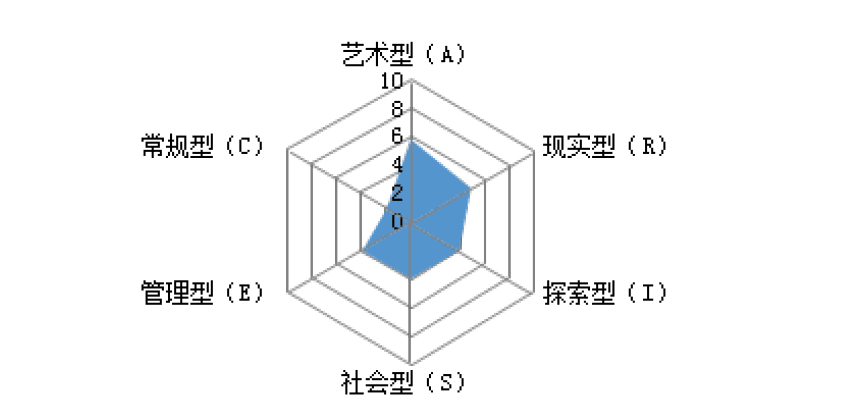

  //设置网格线

            StripLine stripLine1 = new StripLine();

            stripLine1.StripWidth = 1;

            stripLine1.BorderColor = Color.Gray;

            stripLine1.BorderDashStyle = ChartDashStyle.Solid;

            stripLine1.BorderWidth = 1;

            stripLine1.Interval = 2;


            // Consider adding transparency so that the strip lines are lighter

            stripLine1.BackColor = Color.FromArgb(120, Color.Red);


            stripLine1.BackSecondaryColor = Color.White;

            stripLine1.BackGradientStyle = GradientStyle.LeftRight;


            // Add the strip line to the chart

            ca.AxisY.StripLines.Add(stripLine1);