JQChart+SQL+数组相关的问题

左手青春右手年华 2016-02-25 02:45:56
SQL语句:select CONVERT(varchar(100), dt, 23) as dt,sum(pmoney) as a1,sum(historical_cost)as b1,(sum(pmoney)-sum(historical_cost))as c1 from S_StorageForm where type=2 group by dt


取出数据效果图:其实是三列三组类型的数据
[dt,a1]
[dt,b2]
[dt,c1]

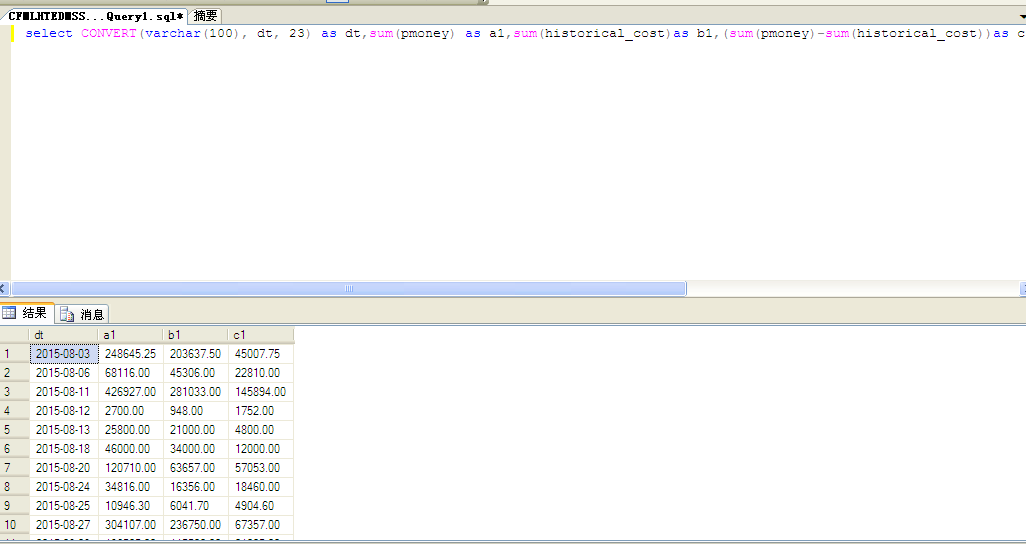
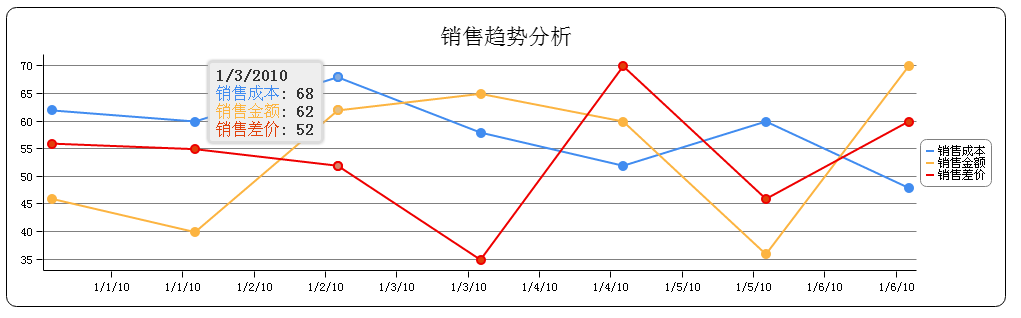
目的是想匹配这个是JQchart里面的,JS代码段:

data: [[new Date(2010, 0, 1), 56], [new Date(2010, 0, 2), 55],
[new Date(2010, 0, 3), 52], [new Date(2010, 0, 4), 35],
[new Date(2010, 0, 5), 70], [new Date(2010, 0, 6), 46],
[new Date(2010, 0, 7), 60]]

最终效果
...全文
117 1 打赏 收藏 转发到动态 举报
AI 作业
写回复
用AI写文章
1 条回复
切换为时间正序
请发表友善的回复…
发表回复
  • 打赏
  • 举报
回复
 <script type="text/javascript">
        $(document).ready(function () {
            $('#jqChart').jqChart({
                title: { text: '销售趋势分析' },
                tooltips: { type: 'shared' },
                animation: { duration: 1 },
                axes: [
                    {
                        location: 'bottom',
                        type: 'dateTime',
                        labels: {
                            stringFormat: 'm/d/yy'
                        }
                    }
                ],
                series: [
                    {
                        type: 'line',
                        title: '销售成本',
                        strokeStyle: '#418CF0',
                        lineWidth: 2,
                        data: [[new Date(2010, 0, 1), 62], [new Date(2010, 0, 2), 60],
                               [new Date(2010, 0, 3), 68], [new Date(2010, 0, 4), 58],
                               [new Date(2010, 0, 5), 52], [new Date(2010, 0, 6), 60],
                               [new Date(2010, 0, 7), 48]]
                    },
                    {
                        type: 'line',
                        title: '销售金额',
                        strokeStyle: '#FCB441',
                        lineWidth: 2,
                        data: [[new Date(2010, 0, 1), 46], [new Date(2010, 0, 2), 40],
                               [new Date(2010, 0, 3), 62], [new Date(2010, 0, 4), 65],
                               [new Date(2010, 0, 5), 60], [new Date(2010, 0, 6), 36],
                               [new Date(2010, 0, 7), 70]]
                    },
					
					{
                        type: 'line',
                        title: '销售差价',
                        strokeStyle: '#EE0000',
                        lineWidth: 2,
                        data: [[new Date(2010, 0, 1), 56], [new Date(2010, 0, 2), 55],
                               [new Date(2010, 0, 3), 52], [new Date(2010, 0, 4), 35],
                               [new Date(2010, 0, 5), 70], [new Date(2010, 0, 6), 46],
                               [new Date(2010, 0, 7), 60]]
                    }
					
					
                ]
            });
        });
    </script>
怎么实现呢?请高手指点下

62,243

社区成员

发帖
与我相关
我的任务
社区描述
.NET技术交流专区
javascript云原生 企业社区
社区管理员
  • ASP.NET
  • .Net开发者社区
  • R小R
加入社区
  • 近7日
  • 近30日
  • 至今
社区公告

.NET 社区是一个围绕开源 .NET 的开放、热情、创新、包容的技术社区。社区致力于为广大 .NET 爱好者提供一个良好的知识共享、协同互助的 .NET 技术交流环境。我们尊重不同意见,支持健康理性的辩论和互动,反对歧视和攻击。

希望和大家一起共同营造一个活跃、友好的社区氛围。

试试用AI创作助手写篇文章吧