社区
Windows客户端开发
帖子详情
将 IL 代码编译为本机代码时不存在 PDB 文件。
你好,小黄同学
2016-04-26 09:35:15
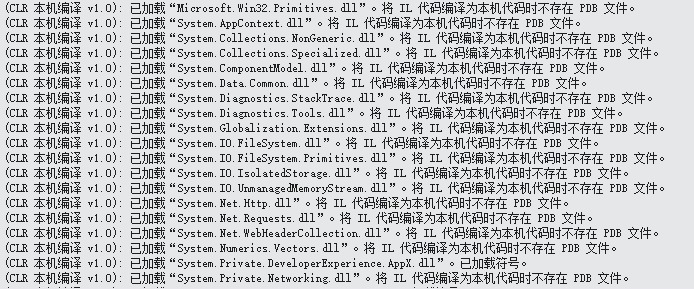
vs2015, debug下运行没有问题,release就出现 “将 IL 代码编译为本机代码时不存在 PDB 文件。” 而且只是在输出中显示,并没有报错,
导致注册的后台任务没有运行效果,
...全文
1535
1
打赏
收藏
将 IL 代码编译为本机代码时不存在 PDB 文件。
vs2015, debug下运行没有问题,release就出现 “将 IL 代码编译为本机代码时不存在 PDB 文件。” 而且只是在输出中显示,并没有报错, 导致注册的后台任务没有运行效果,
复制链接
扫一扫
分享
转发到动态
举报
写回复
配置赞助广告
用AI写文章
1 条
回复
切换为时间正序
请发表友善的回复…
发表回复
打赏红包
你好,小黄同学
2016-04-26
打赏
举报
回复
Il
2CppDumper 1.0.19反
编译
工具.zip
软件介绍:
Il
2CppDumper对于U3D游戏是反
编译
神器,这个是高级版本,使用起来也比较方便,还自带脚本编辑,运行
Il
2CppDumper.exe开始用
il
2cpp反
编译
工具 提取目标app的两个
文件
。反
编译
操作说明:双击运行
Il
2CppDumper.exe,依次打开lib
il
2cpp.so和global-metadata.dat,新手选择自动即可。config.json
Il
2CppDumper.exe
Il
2CppDumper.
pdb
Step
IL
:Step
IL
允许您使用Visual Studio的调试器逐步浏览项目的已
编译
IL
(中间语言; .NET操作码)。 (通常,您只能单步执行C#
代码
或简化的机器
代码
。)
指示 通常使用Visual Studio
编译
程序。 这将创建一个已
编译
的二进制
文件
( .exe或.dll )和一个符号
文件
( .
pdb
)。 运行Step
IL
并在命令行上将
编译
后的二进制
文件
传递给它。 例如: Step
IL
.exe MyProgram.exe 此命令将用一个新的.
pdb
文件
覆盖该
文件
,还将创建一个.
il
文件
(在同一目录中),其中包含二进制
文件
中的所有
IL
代码
。 在Visual Studio中按F10键开始调试程序。 如果提示您输入.
il
文件
,请浏览至该
文件
。 现在,您将逐步完成
IL
代码
。 您可以使用“跳过”(F10),“进入”(F11),“运行到光标”等所有功能。 所有正常的调试机制(本地,监视,调用堆栈等)都应起作用。 如果您的
代码
在另一个程序集(通常是一个库)中调用其源
代码
也在项目解决方案中的
代码
,则当您进入(F11)库
代码
时
,调试器将跳入C#
代码
。 您可以
IL
Spy 功能强大的.net反
编译
工具
IL
Spy 功能强大的.net反
编译
工具 简单易用,免费。不需要.
pdb
,直接反
编译
IL
.
.NET程序反
编译
神器Reflector 7.6.0.233 VSPro Edition
Red-Gate Reflector 7.6.0.233 VS Pro Edition Pre-cracked by HF-Death / InFiNiTy-Team Debug any .NET assembly in Visual Studio : Enable debugging for 3rd party assemblies Quickly select assemblies to debug within Visual Studio. .NET Reflector generates
PDB
f
il
es for decomp
il
ed assemblies, so you can debug them as eas
il
y as your own code. Debug decomp
il
ed assemblies using the Visual Studio debugger Now you can step through debugging of any decomp
il
ed assemblies as if they were your own. Set breakpoints, watch variables, set next statements, modify variable values, or use any of your other regular debugging techniques. Decomp
il
e and explore assemblies on the fly: Dynamic decomp
il
ation With Reflector VSPro, assemblies decomp
il
e seamlessly in Visual Studio. So source code is always ava
il
able for your libraries, and you can go straight to the definition of any code, either from the context menu, or by hitting F12 Browse decomp
il
ed assemblies .NET Reflector VSPro adds the Reflector Object Browser into Visual Studio. Use the simple tree view to navigate through all types and members, and click to see the decomp
il
ed code. A 2-Minute Demo of .NET Reflector VSPro Debug any .NET assembly in Visual Studio: Enable debugging for 3rd party assemblies Quickly select assemblies to debug within Visual Studio. .NET Reflector generates
PDB
f
il
es for decomp
il
ed assemblies, so you can debug them as eas
il
y as your own code. Select assemblies to decomp
il
e and debugSelect assemblies to debug The
PDB
f
il
es are saved for future use, so you only need to enable debugging onc for each assembly. Debug decomp
il
ed assemblies using the Visual Studio debugger Now you can step through debugging of any decomp
il
ed assemblies as if they were your own. Set breakpoints, watch variables, set next statements, modify variable values, or use any of your other regular debugging techniques. Debug decomp
il
ed assemblies using the Visual Studio debuggerDebug decomp
il
ed assemblies using the Visual Studio debugger Decomp
il
e and explore assemblies on the fly: Dynamic decomp
il
ation With Reflector VSPro, assemblies decomp
il
e seamlessly in Visual Studio. So source code is always ava
il
able for your libraries, and you can go straight to the definition of any code, either from the context menu, or by hitting F12 Decomp
il
e any referenced assemblyDecomp
il
e any referenced assembly Browse decomp
il
ed assemblies .NET Reflector VSPro adds the Reflector Object Browser into Visual Studio. Use the simple tree view to navigate through all types and members, and click to see the decomp
il
ed code. Browse decomp
il
ed assembliesBrowse decomp
il
ed assemblies Back to top The world’s most advanced .NET decomp
il
er: .NET Reflector VS can decomp
il
e any .NET assembly to C#, VB.NET or
IL
. .NET Reflector VS w
il
l decomp
il
e to high level C# features such as Iterator blocks, Lambda expressions, and LINQ queries. .NET Reflector also supports the C# 4 dynamic type. DotNET Reflector 7.5 Changes: * Many string changes to make things easier to understand * Assorted design changes to dialogs and screens * Improvements to the installation experience of the package * Improved the speed of type by type decomp
il
ation * Improved handling of the case where the add-in is superseded by the package (we remove the old menu items) * Error reporting experience is more fine-tuned. Users have options to be notified of work-arounds and fixes * Hide menu items such as “enable debugging”, instead of just disabling them * Make “enable debugging” work on all items of the tree, rather than just the top level assembly item * "Go to decomp
il
ed definition" more commonly enabled. * Setting a break point causes the necessary
PDB
f
il
e to be automatically generated * Decomp
il
ed code can now be stepped-into like any other code * Attempting to step into inaccessible code triggers instructions on how to debug it correctly * Multiple
PDB
s can now be generated in parallel o
PDB
generation can currently take a little time, especially if you’re generating several or the assemblies are particularly large * The trial dialog screen has been updated to be more informative and clear * Re-introduced “Go to Decomp
il
ed Definition” right-click menu item * Improved support for ‘Go to Definition’(F12) in code without source * A number of simple usab
il
ity enhancements * A number of licensing and installation bug fixes * Added support for ‘Go to Definition’(F12) in code without source * Improved path to decomp
il
ed code * Improved path to
pdb
generation for code you want to debug * Completed move to a VS Package * Started transition from a VS Add-in to a VS Package * Added support for VS11 * Turned on SmartAssembly feature usage reporting on by default for all EA bu
il
ds * Added loaded project references to the Reflector Object Browser (ROB) * Double click on any type in the ‘ROB’ to decomp
il
e in a new VS editor pane * Added a Reflector ‘Go to Definition’ context menu item to navigate through code without source * Added a new ‘Reflector Object Browser’(ROB) into Visual Studio (w
il
l eventually offer decomp
il
ation by type inside VS) * Changed the way Reflector shows the version number to display the correct bu
il
d number * Bug fixes: o “Open in Reflector” context menu not working. o XAML Source Code is wrong delimited. o Missing end tag in XAML Translation. o Code generation for different versions of the same assembly o ‘Flatten Namespaces’ dialog o Various decomp
il
ation and assembly-loading problems have been fixed – drop us a note if you’d like to know more. DotNET Reflector 7.6.0.233 VS Pro Edition Cracked HF-Death / InFiNiTy-Team
Unity
IL
代码
注入(基础)
一、什么是
代码
注入 C#程序
编译
生成中间
代码
IL
,为了实现问题修复和一些通用功能扩展,通常所使用的就是
代码
注入。 xlua的热修复方案即采用了
代码
注入的方式,没有污染C#
代码
,也不需要提前埋点,十分方便。 再比如这篇文章讲述了使用
代码
注入来做一些工具,:自动注入
代码
统计每个函数的执行效率以及内存分配 方案
代码
注入需要借助一个注入工具,就是Mono.Cec
il
开发包,它可以让我们对
编译
好的程序集进行
IL
代码
注入。 http://www.mono-project.com/docs/tools+li
Windows客户端开发
7,657
社区成员
18,845
社区内容
发帖
与我相关
我的任务
Windows客户端开发
Windows Phone是微软发布的一款手机操作系统,它将微软旗下的Xbox LIVE游戏、Zune音乐与独特的视频体验整合至手机中。
复制链接
扫一扫
分享
社区描述
Windows Phone是微软发布的一款手机操作系统,它将微软旗下的Xbox LIVE游戏、Zune音乐与独特的视频体验整合至手机中。
社区管理员
加入社区
获取链接或二维码
近7日
近30日
至今
加载中
查看更多榜单
社区公告
暂无公告
试试用AI创作助手写篇文章吧
+ 用AI写文章


 发帖
发帖 与我相关
与我相关 我的任务
我的任务
 分享
分享 导致注册的后台任务没有运行效果,