

81,111
社区成员
 发帖
发帖 与我相关
与我相关 我的任务
我的任务
 分享
分享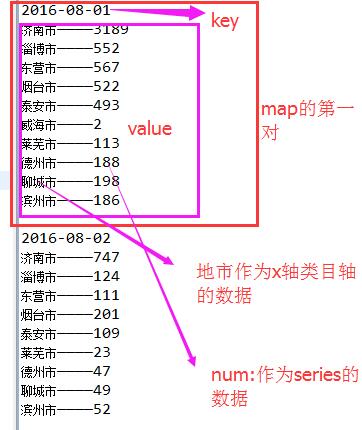
package echarts.servlet;


import java.io.IOException;

import java.io.PrintWriter;

import java.util.ArrayList;

import java.util.HashMap;

import java.util.Map;


import javax.servlet.ServletException;

import javax.servlet.http.HttpServlet;

import javax.servlet.http.HttpServletRequest;

import javax.servlet.http.HttpServletResponse;


import net.sf.json.JSONArray;


import echarts.bean.Record;

import echarts.bean.Starttime;

import echarts.dao.RecordDAO;


public class RecordServlert extends HttpServlet {


	public void doGet(HttpServletRequest request, HttpServletResponse response)

			throws ServletException, IOException {


		request.setCharacterEncoding("utf-8");

		response.setCharacterEncoding("utf-8");


		RecordDAO redao = new RecordDAO();

		ArrayList<Starttime>  arr = redao.getStarttime();

		Map<String, ArrayList<Record>> map = redao.getAll(arr);


        JSONArray json=JSONArray.fromObject(map);

        response.setContentType("text/html; charset=utf-8");

        System.out.println("转成json");

        System.out.println(json.toString());

        //返回给前段页面

        PrintWriter out = response.getWriter();

        out.print(json);

        out.flush();

        out.close();


	}


	public void doPost(HttpServletRequest request, HttpServletResponse response)

			throws ServletException, IOException {


		doGet(request, response);


	}


}
<%@ page language="java" import="java.util.*" pageEncoding="utf-8"%>

<%

String path = request.getContextPath();

String basePath = request.getScheme()+"://"+request.getServerName()+":"+request.getServerPort()+path+"/";

%>


<!DOCTYPE HTML PUBLIC "-//W3C//DTD HTML 4.01 Transitional//EN">

<html>

  <head>

    <base href="<%=basePath%>">


    <title>Echarts_demo01</title>

    <script src="./js/echarts.js"></script>

    <script src="./js/esl.js"></script>

    <script src="./js/jquery-1.7.2.min.js"></script>


  </head>


  <body>


  		<!-- 为ECharts准备一个具备大小(宽高)的Dom -->

	<div id="main" style="height:400px;width:700px;"></div>


	<script type="text/javascript">


		// 基于准备好的dom,初始化echarts图表

		var myChart = echarts.init(document.getElementById('main'));

		myChart.showLoading({text:'正在加载数据'});


		option = {

		    baseOption: {

		        timeline: {

		            // y: 0,

		            axisType: 'category',

		            // realtime: false,

		            // loop: false,

		            autoPlay: true,

		            // currentIndex: 2,

		            playInterval: 1000,

		            // controlStyle: {

		            //     position: 'left'

		            // },

		            data:(function(){

                             var arr=[];

                             $.ajax({

                                 type : "post",

                                 async : false, //同步执行

                                 url : "RecordServlet",

                                 data : {},

                                 dataType : "json", //返回数据形式为json

                                 success : function(result) {

                                 console.log("s");

	                                 if (result) {

	                                      for(var i=0;i<result.length;i++){

		                                      console.log(result[i].starttime);

		                                      arr.push(result[i].starttime);

                                 		  }

                               		 }


                             	  },

                              error : function(errorMsg) {

	                              alert("图表请求数据失败!");

	                              myChart.hideLoading();

                              }

                          })

                           return arr;

                        }),


		            label: {

		                formatter : function(s) {

		                    return (new Date(s)).getFullYear();

		                }

		            }

		        },

		        title: {

		            text: '每日各地市漫游次数统计'

		        },

		        tooltip: {},

		        legend: {

		            x: 'right',

		            data: ['漫游次数'],


		        },

		        calculable : true,

		        grid: {

		            top: 80,

		            bottom: 100

		        },

		        xAxis: [

		            {

		                type:'category',

		                axisLabel:{'interval':0},

		                data:[],

		                splitLine: {show: false}

		            }

		        ],

		        yAxis: [

		            {

		                type: 'value',

		                name: '次数(次)',

		                // max: 53500

		                max: 20000

		            }

		        ],

		        series: [

		            {name: '漫游次数',

		             type: 'bar',

		             data:[]

		            },

		        ]

		    },


		};

				// 为echarts对象加载数据

				myChart.setOption(option);


				getChartData();


		function getChartData(){

					var options = myChart.getOption();

                             $.ajax({

                                 type : "post",

                                 async : false, //同步执行

                                 url : "${pageContext.request.contextPath}/RecordServlet",

                                 data : {},

                                 dataType : "json", //返回数据形式为json

                                 success : function(result) {

	                                 if (result) {

		                                 for(var i=0;i<result.length;i++){

												options.xAxis[0].data = result[i].record.name;

												options.series[0].data = result[i].record.num;


												myChart.hideLoading();

												myChart.setOption(options);

										}

                               		 }


                             	  },

                              error : function(errorMsg) {

	                              alert("请求数据失败!");

	                              myChart.hideLoading();

                              }

                          })

                        }


	</script>


  </body>

</html>

<!DOCTYPE html>
	<head>
		<meta charset="utf-8">
		<title>ECharts</title>

		<!-- ECharts单文件引入 -->

		<script src="echarts.js"></script>

	</head>
<body>
	<!-- 为ECharts准备一个具备大小(宽高)的Dom -->
	<div id="main" style="height:400px;width:700px;"></div>

	<script type="text/javascript">

		// 基于准备好的dom,初始化echarts图表
		var myChart = echarts.init(document.getElementById('main'));


		option = {
		    baseOption: {
		        timeline: {
		            // y: 0,
		            axisType: 'category',
		            // realtime: false,
		            // loop: false,
		            autoPlay: true,
		            // currentIndex: 2,
		            playInterval: 1000,
		            // controlStyle: {
		            //     position: 'left'
		            // },
		            data: [
		                '2002-01-01','2003-01-01','2004-01-01',
		                {
		                    value: '2005-01-01',
		                    tooltip: {
		                        formatter: '{b} GDP达到一个高度'
		                    },
		                    symbol: 'diamond',
		                    symbolSize: 16
		                },
		                '2006-01-01', '2007-01-01','2008-01-01','2009-01-01','2010-01-01',
		                {
		                    value: '2011-01-01',
		                    tooltip: {
		                        formatter: function (params) {
		                            return params.name + 'GDP达到又一个高度';
		                        }
		                    },
		                    symbol: 'diamond',
		                    symbolSize: 18
		                },
		            ],
		            label: {
		                formatter : function(s) {
		                    return (new Date(s)).getFullYear();
		                }
		            }
		        },
		        title: {
		            subtext: '数据来自国家统计局'
		        },
		        tooltip: {},
		        legend: {
		            x: 'right',
		            data: ['金融'],

		        },
		        calculable : true,
		        grid: {
		            top: 80,
		            bottom: 100
		        },
		        xAxis: [
		            {
		                'type':'category',
		                'axisLabel':{'interval':0},
		                'data':[
		                    '北京','\n天津','河北','\n山西','内蒙古','\n辽宁','吉林','\n黑龙江',
		                    '上海','\n江苏','浙江','\n安徽','福建','\n江西','山东','\n河南',
		                    '湖北','\n湖南','广东','\n广西','海南','\n重庆','四川','\n贵州',
		                    '云南','\n西藏','陕西','\n甘肃','青海','\n宁夏','新疆'
		                ],
		                splitLine: {show: false}
		            }
		        ],
		        yAxis: [
		            {
		                type: 'value',
		                name: 'GDP(亿元)',
		                // max: 53500
		                max: 30000
		            }
		        ],
		        series: [
		            {name: '金融', type: 'bar'},
		        ]
		    },
		    options: [
		        {
		            title: {text: '2002全国宏观经济指标'},
		            series: [
		                {data: [561.91,76.86,179.6,124.1,48.39,137.18,75.45,31.6,485.25,368.86,347.53,81.85,138.28,76.51,310.07,158.77,96.95,92.43,454.65,35.86,10.08,134.52,183.13,41.45,102.39,2.81,67.3,42.08,16.75,21.45,52.18]},

		            ]
		        },
		        {
		            title : {text: '2003全国宏观经济指标'},
		            series : [
		                {data: [635.56,112.79,199.87,118.48,55.89,145.38,73.15,32.2,517.97,392.11,451.54,87.45,150.09,64.31,329.71,165.11,107.31,99.35,534.28,61.59,10.68,147.04,206.24,48.01,105.48,4.74,77.87,42.31,17.98,24.8,64.92]},
		            ]
		        },
		        {
		            title : {text: '2004全国宏观经济指标'},
		            series : [
		                {data: [713.79,136.97,209.1,110.29,55.89,188.04,77.17,32.2,612.45,440.5,523.49,94.1,171,65.1,343.37,170.82,118.85,118.64,602.68,74,11.56,162.38,236.5,60.3,118.4,5.4,90.1,42.99,19,27.92,70.3]},
		            ]
		        },
		        {
		            title : {text: '2005全国宏观经济指标'},
		            series : [
		                {data: [840.2,147.4,213.47,135.07,72.52,232.85,83.63,35.03,675.12,492.4,686.32,127.05,186.12,69.55,448.36,181.74,127.32,162.37,661.81,91.93,13.16,185.18,262.26,73.67,130.5,7.57,127.58,44.73,20.36,32.25,80.34]},
		            ]
		        },
		        {
		            title : {text: '2006全国宏观经济指标'},
		            series : [
		                {data: [982.37,186.87,284.04,169.63,108.21,303.41,100.75,74.17,825.2,653.25,906.37,166.01,243.9,79.75,524.94,219.72,174.99,204.72,899.91,129.14,16.37,213.7,299.5,89.43,143.62,6.44,152.25,50.51,23.69,36.99,99.25]},
		            ]
		        },
		        {
		            title : {text: '2007全国宏观经济指标'},
		            series : [
		                {data: [1302.77,288.17,347.65,218.73,148.3,386.34,126.03,155.48,1209.08,1054.25,1251.43,223.85,385.84,101.34,734.9,302.31,337.27,260.14,1705.08,190.73,34.43,247.46,359.11,122.25,168.55,11.51,231.03,61.6,27.67,51.05,149.22]},
		            ]
		        },
		        {
		            title : {text: '2008全国宏观经济指标'},
		            series : [
		                {data: [1519.19,368.1,420.74,290.91,219.09,455.07,147.24,177.43,1414.21,1298.48,1653.45,313.81,497.65,130.57,880.28,413.83,393.05,334.32,1972.4,249.01,47.33,303.01,411.14,151.55,277.66,22.42,287.16,72.49,36.54,64.8,171.97]},
		            ]
		        },
		        {
		            title : {text: '2009全国宏观经济指标'},
		            series : [
		                {data: [1603.63,461.2,525.67,361.64,291.1,560.2,180.83,227.54,1804.28,1596.98,1899.33,359.6,612.2,165.1,1044.9,499.92,479.11,402.57,2283.29,336.82,65.73,389.97,524.63,194.44,351.74,23.17,336.21,88.27,45.63,75.54,198.87]},
		            ]
		        },
		        {
		            title : {text: '2010全国宏观经济指标'},
		            series : [
		                {data: [1863.61,572.99,615.42,448.3,346.44,639.27,190.12,304.59,1950.96,2105.92,2326.58,396.17,767.58,241.49,1361.45,697.68,561.27,463.16,2658.76,384.53,78.12,496.56,654.7,231.51,375.08,27.08,384.75,100.54,54.53,97.87,225.2]},
		            ]
		        },
		        {
		            title : {text: '2011全国宏观经济指标'},
		            series : [
		                {data: [2215.41,756.5,746.01,519.32,447.46,755.57,207.65,370.78,2277.4,2600.11,2730.29,503.85,862.41,357.44,1640.41,868.2,674.57,501.09,2916.13,445.37,105.24,704.66,868.15,297.27,456.23,31.7,432.11,145.05,62.56,134.18,288.77]},
		            ]
		        }
		    ]
		};
				// 为echarts对象加载数据
				myChart.setOption(option);

	</script>


</body>
</html>
