16,216
社区成员
 发帖
发帖 与我相关
与我相关 我的任务
我的任务
 分享
分享
QHBoxLayout *m_hLayout=new QHBoxLayout;
QPushButton *m_pushButton=new QPushButton;
m_pushButton->setText(tr("截图"));
connect(m_pushButton,SIGNAL(clicked()),this,SLOT(test()));
m_hLayout->addWidget(m_pushButton);
m_hLayout->addStretch();
m_pViewer = new QChartViewer(this);
m_pVLayout->addLayout(m_hLayout);
m_pVLayout->addWidget(m_pViewer);
m_pVLayout->addStretch();
this->setLayout(m_pVLayout);
// Create a PieChart object of size 360 x 300 pixels
m_piechart = new PieChart(860, 600);
m_piechart->setDefaultFonts("mingliu.ttc", "mingliu.ttc Bold");
// Set the center of the pie at (180, 140) and the radius to 100 pixels
m_piechart->setPieSize(300, 260, 230);
// Add a title to the pie chart
m_piechart->addTitle(strTitle.toStdString().c_str(),"mingliu.ttc Bold",18)->setMargin(0,0,8,8);
// add a legend box where the top left corner is at (330, 50)
m_piechart->addLegend(650, 60);
// Output the chart
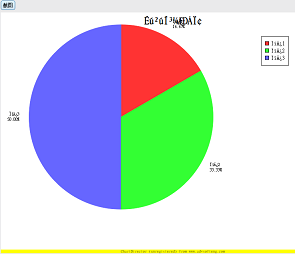
double data[] = {1, 2, 3};
// The labels for the bar chart
const char *labels[] = {"项目1", "项目2", "项目3"};
m_piechart->setData(DoubleArray(data, sizeof(data)/sizeof(data[0])), StringArray(labels,
sizeof(labels)/sizeof(labels[0])));
m_pViewer->setChart(m_piechart);
m_pViewer->show();
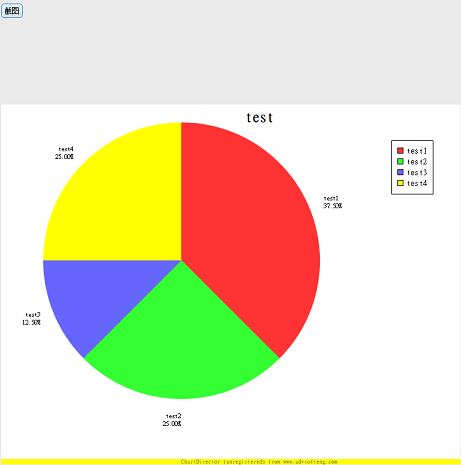
    double data[] = {3, 2, 1,2};

	// The labels for the bar chart

	const char *labels[] = {"test1", "test2", "test3", "test4"};

	m_piechart->setData(DoubleArray(data, sizeof(data)/sizeof(data[0])), StringArray(labels,

		sizeof(labels)/sizeof(labels[0])));

	m_pViewer->setChart(m_piechart);

	m_pViewer->updateViewPort(true, true);

	m_pViewer->updateDisplay();
    m_pVLayout->removeWidget(m_pViewer);;

	delete m_pViewer;

	delete m_piechart;


	m_pViewer = new QChartViewer(this);

	m_pVLayout->addWidget(m_pViewer);

	//this->setLayout(m_pVLayout);

	// Create a PieChart object of size 360 x 300 pixels

	m_piechart = new PieChart(860, 600);

    ...........