去搜下chart的使用教程吧,属性太多
winform下画曲线不熟悉,所以无法帮,不过现有的常用曲线控件百度肯定有例子。
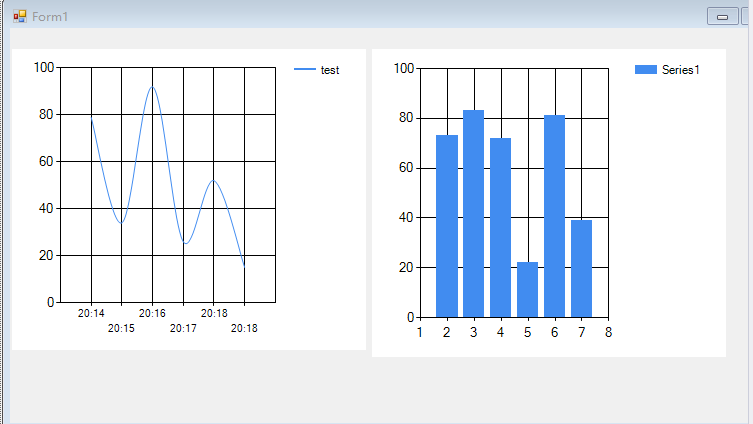
Chart
挺多的,winform下有微软的chart,dev的chartcontrol等。wpf下就更多了,mschart,dynamicdatadisply,abt scichart,visifire chart等等。
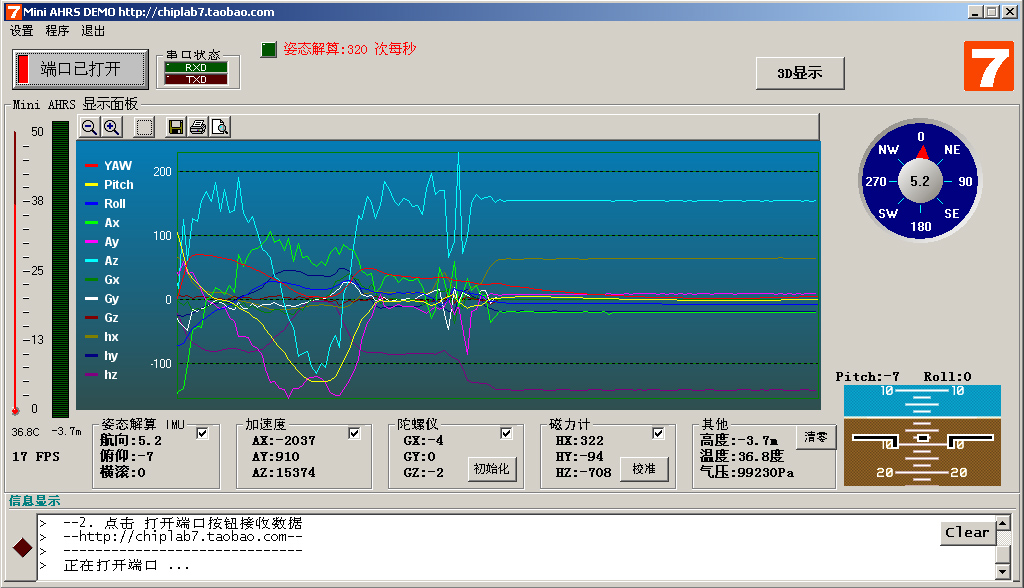
你这是私人定制的(自己画就可以) 用通用的控件得不偿失
110,538
社区成员
642,577
社区内容
加载中
让您成为最强悍的C#开发者
试试用AI创作助手写篇文章吧


 发帖
发帖 与我相关
与我相关 我的任务
我的任务
 分享
分享