

87,917
社区成员
 发帖
发帖 与我相关
与我相关 我的任务
我的任务
 分享
分享
<script type="text/javascript">


var dom = document.getElementById("dss");

var myChart = echarts.init(dom);

var app = {};

option = null;


option = {

    tooltip: {},


    geo: {

        map: 'henans',

        roam: false,

        nameMap:{

          'zhengzhou':'上午'

        },

        label: {

            normal: {

                show: true,

                textStyle: {

                    color: 'rgba(0,0,0,0.4)'

                }

            }

        },

        itemStyle: {

            normal:{

                borderColor: 'rgba(0, 0, 0, 0.2)'

            },

            emphasis:{

                areaColor: null,

                shadowOffsetX: 0,

                shadowOffsetY: 0,

                shadowBlur: 20,

                borderWidth: 0,

                shadowColor: 'rgba(0, 0, 0, 0.5)'

            }

        },

        /*regions: [{

            name: '郑州',

            itemStyle: {

                normal: {

                    areaColor: 'red',

                    color: 'red'

                }

            }

        }]*/

    },

    series : [

       {

           type: 'map',

           name:'河南',

           map:'beijing',

           coordinateSystem: 'geo',

           //data: convertData(data),


           label: {

               normal: {

                   formatter: '{b}',

                   position: 'right',

                   show: true

               },

               emphasis: {

                   show: true

               }

           },


        },


    ]

};;

if (option && typeof option === "object") {

    myChart.setOption(option, true);

}

       </script>

 我插件可能是假的。。。不如你把你的插件发给我把fate_dogel@163.com[/quote]
Demo已发
我插件可能是假的。。。不如你把你的插件发给我把fate_dogel@163.com[/quote]
Demo已发

data:[
{name: '南阳市', value: 31796}
]


<!DOCTYPE html>
<html lang="zh-CN">
<head>
<meta charset="utf-8">
<title>EChartsExample</title>
<script src="jquery-2.1.4.min.js" type="text/javascript"></script>
<script src="echarts.js" type="text/javascript"></script>
<script src='henan.js' type="text/javascript"></script>
<script src='china.js' type="text/javascript"></script>
</head>
<body>
<div id="dss" style="width: 50%;height:800px; overflow:scroll;">地图:
</div>
<script>
var dom = document.getElementById("dss");
var myChart = echarts.init(dom);
var app = {};
option = null;
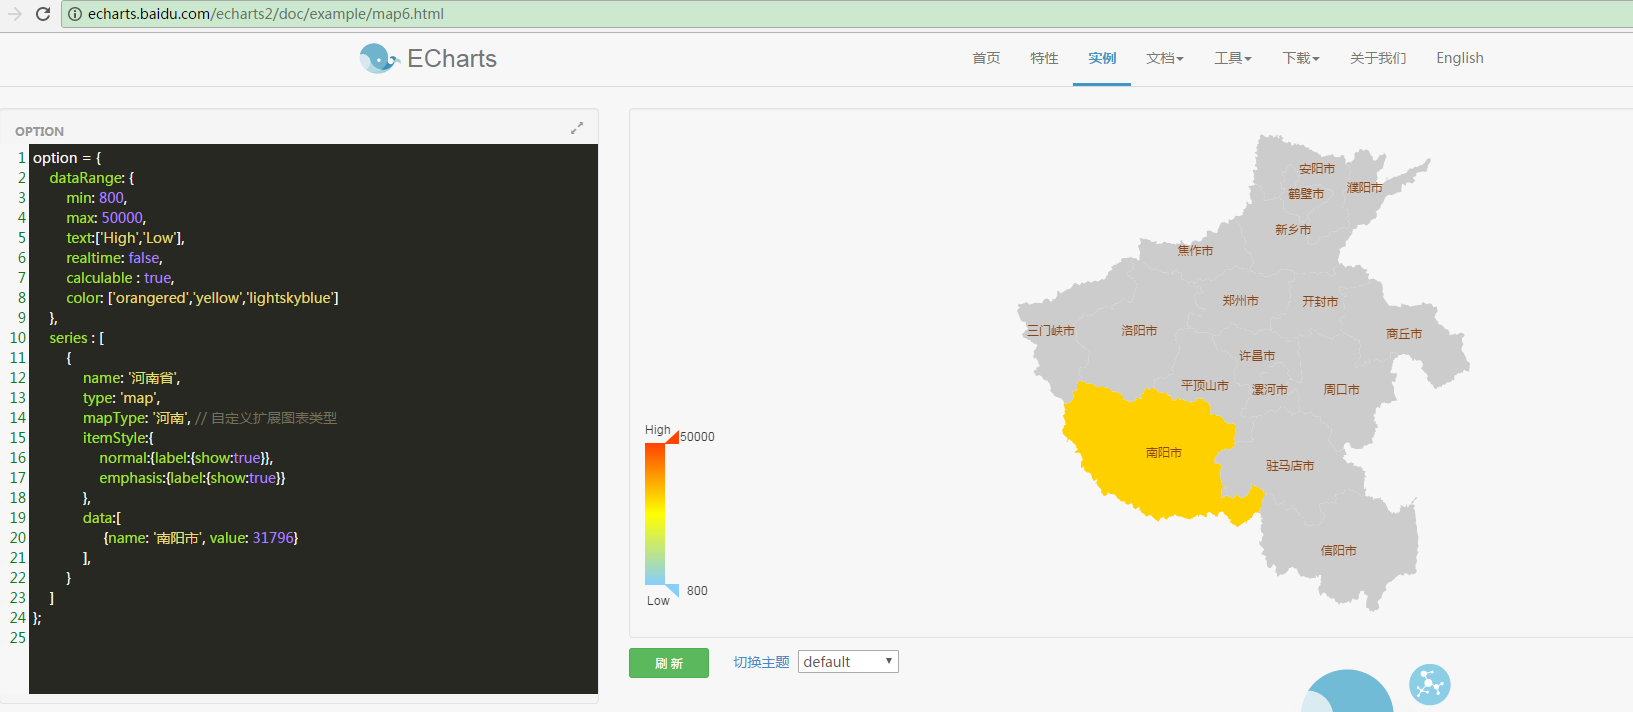
option = {
dataRange: {
min: 800,
max: 50000,
text:['High','Low'],
realtime: false,
calculable : true,
color: ['orangered','yellow','lightskyblue']
},
series : [
{
name: '河南省',
type: 'map',
mapType: '河南',
itemStyle:{
normal:{label:{show:true}},
emphasis:{label:{show:true}}
},
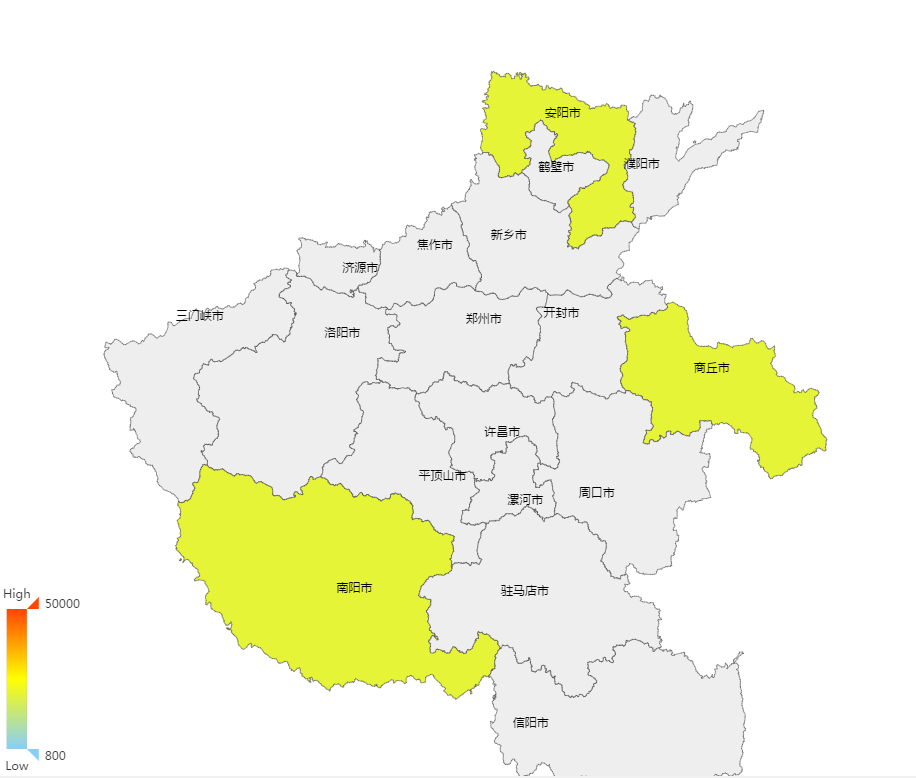
data:[
{name: '南阳市', value: 20057.34},
{name: '商丘市', value: 20057.34},
{name: '安阳市', value: 20057.34}
]
}
]
};
if (option && typeof option === "object") {
myChart.setOption(option, true);
}
</script>
</body>
</html>
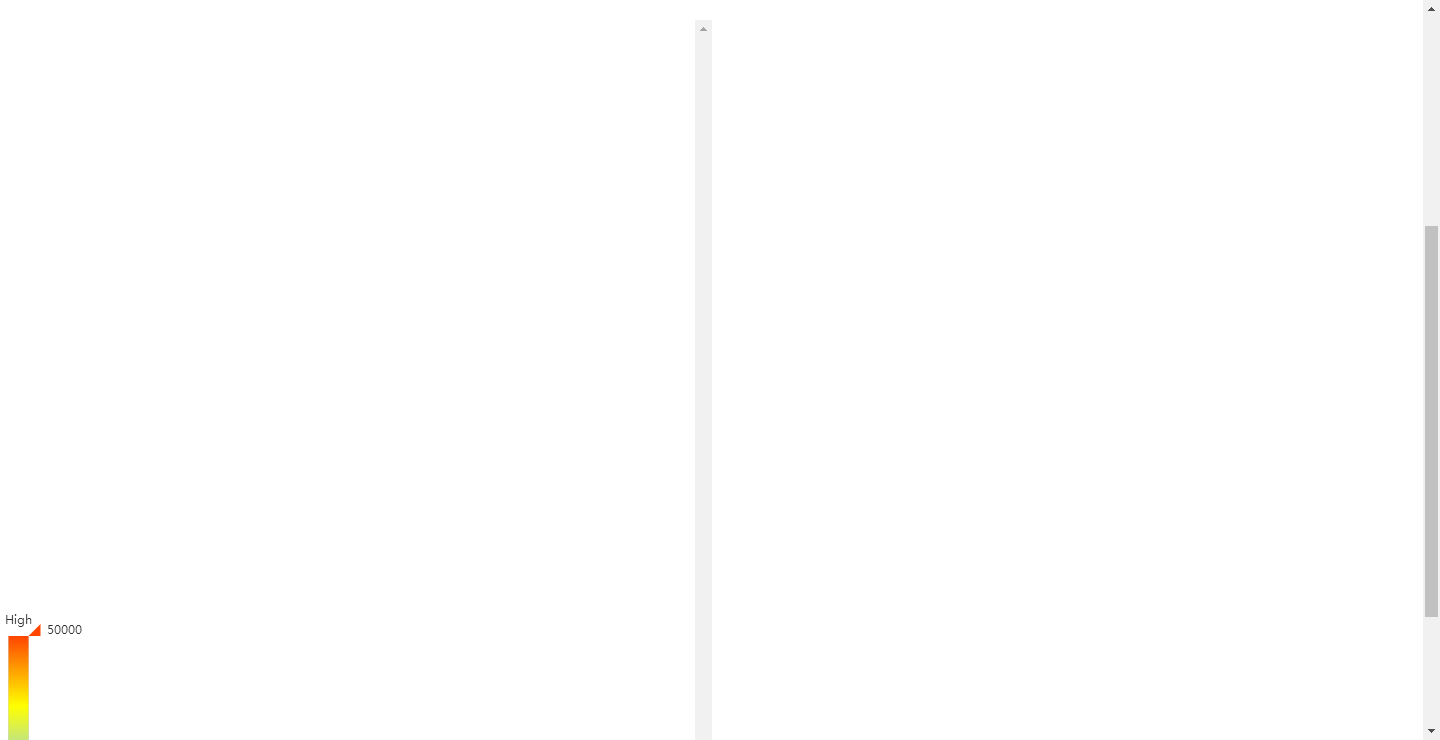
    dataRange: {
        min: 800,
        max: 50000,
        text:['High','Low'],
        realtime: false,
        calculable : true,
        color: ['orangered','yellow','lightskyblue']
    },
 我查了他官网的手册没有这个属性啊
[/quote]
我查了他官网的手册没有这个属性啊
[/quote]
 哎哟 虽然我没用过这个东西,但帮你测试了的啊
[/quote]
我照着你写的就成这样了
哎哟 虽然我没用过这个东西,但帮你测试了的啊
[/quote]
我照着你写的就成这样了 你的地图是在哪下的?[/quote]
 没有下载 网站示例直接编辑的http://echarts.baidu.com/echarts2/doc/example/map6.html
[/quote]
直接在线的是用json不太会啊。。。
没有下载 网站示例直接编辑的http://echarts.baidu.com/echarts2/doc/example/map6.html
[/quote]
直接在线的是用json不太会啊。。。
    dataRange: {

        min: 800,

        max: 50000,

        text:['High','Low'],

        realtime: false,

        calculable : true,

        color: ['orangered','yellow','lightskyblue']

    },
    dataRange: {

        min: 800,

        max: 50000,

        text:['High','Low'],

        realtime: false,

        calculable : true,

        color: ['orangered','yellow','lightskyblue']

    },
    dataRange: {

        min: 800,

        max: 50000,

        text:['High','Low'],

        realtime: false,

        calculable : true,

        color: ['orangered','yellow','lightskyblue']

    },
    dataRange: {
        min: 800,
        max: 50000,
        text:['High','Low'],
        realtime: false,
        calculable : true,
        color: ['orangered','yellow','lightskyblue']
    },
    dataRange: {
        min: 800,
        max: 50000,
        text:['High','Low'],
        realtime: false,
        calculable : true,
        color: ['orangered','yellow','lightskyblue']
    },

