JavaScript

可视化数据、D3JS问题
 墨衍会员 · AI 创作全网分发 墨衍智能分发 通过墨衍一键同步至各平台 可同步平台 CSDN微信公众号微博知乎掘金百家号博客园抖音小红书 你的文章也可以这样分发 墨衍会员 ¥399起/年,写一次发全网
我也要 关注 + 加入社区
代码在此,不知道为何在浏览器上无法显示图表,画布是有的,我F12都可以看到颜色,就是显示不出来,我怀疑是不是像素大小问题,这块有些疑问,忘大大指教
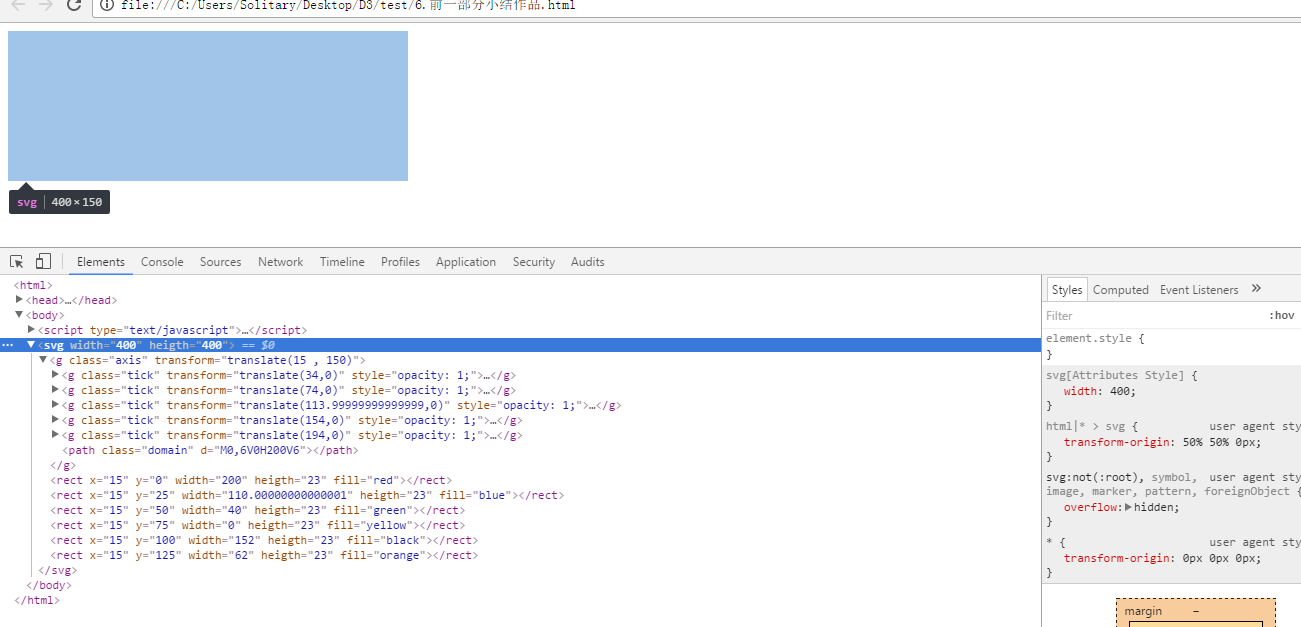
<html>

	<head>

       <meta charset="GBK">

       <title>单元小结</title>

       <script type="text/javascript" src="d3.js"></script>


	<!--设定坐标轴的样式和位置-->

	   <style>

			.axis path,

			.axis line{

				fill: none;

				stroke: black;

				shape-rendering: crispEdges;

			}


			.axis text {

				font-family: sans-serif;

				font-size: 11px;

			}

	</style>

	</head>


	<body>

		<script type="text/javascript">

			//1.准备数据

			var index = [123 , 78 , 43 , 23 , 99 , 54];

			var color = ["red", "blue", "green", "yellow", "black" , "orange"];


			//2.准备画布

			var width = 400;

			var heigth = 400;

			var svg = d3.select("body")

						.append("svg")

						.attr("width" , width)

						.attr("heigth" , heigth);


			var max = d3.max(index);

			var min = d3.min(index);

			//2.1画布周边的空白

			var padding = {left:30, right:30, top:20, bottom:20};

			//3.准备线性比例尺

			var linear = d3.scale.linear()

					.domain([min , max])

					.range([0 , 200]);

			//4.准备序数比例尺

			var ordinal = d3.scale.ordinal()

					.domain(index)

					.range(color);

			//5.准备坐标轴

			var axis = d3.svg.axis()

							 .scale(linear)

							 .orient("bottom")

							 .ticks(7);

			//6.设置坐标轴颜色、位置、标签

			svg.append("g")

			   .attr("class" , "axis")

			   .attr("transform" , "translate(15 , 150)")

			   .call(axis);

			//7.每个矩形所占的像素高度(包括空白)

			var rectHeigth = 25;

			//8.做图表

			svg.selectAll("rect")	//先查找到rect矩阵,然后在添加

			   .data(index)

			   .enter()

			   .append("rect")

			   .attr("x" , 15)

			   .attr("y" , function(d , i){

					return i * rectHeigth;

			   })

			   .attr("width" , function(d){

					return linear(d);

			   })

			   .attr("heigth" , rectHeigth-2 )

			   .attr("fill" , function(d){

					return ordinal(d);

			   });


		</script>

	</body>

</html>
...全文
相关推荐
d3js教程两本d3js数据可视化和精通d3js
d3js教程两本d3js数据可视化和精通d3js d3js教程两本d3js数据可视化和精通d3js d3js教程两本d3js数据可视化和精通d3js
d3.js javascript
快速创建图标,超级强大js
JavaScript数据可视化实战
本书深入讲解如何使用JavaScript创建高效、互动的数据可视化图表。从基础图表到复杂地理数据展示,涵盖Flotr2、D3.js和Leaflet等主流工具,结合真实案例,帮助开发者掌握前端数据驱动应用的核心技术。书中还介绍了如何优化用户体验、处理真实世界中的兼容性与性能问题,并通过项目实践构建完整的可视化解决方案,适合中高级前端开发者阅读。
flightdelayviz:在 d3.js 中可视化航班数据
航班延误可视化 使用 d3.js 和 dc.js 对图表进行实验。 。
一个JavaScript库预渲染D3可视化到内联SVG元素
一个JavaScript库,预渲染D3可视化到内联SVG元素,以减少感知页面加载时间并减少无用的绘制闪烁。