c#想把serialport接收到的数据做成仿真曲线

小学工 2017-07-26 11:46:30
想把serialport控件触发的DataReceived事件所接受的数据做成动态的仿真曲线

可是我的软件内部没有chart控件 chart需要下载么

有没有什么思路 求各位大神
...全文
283 14 打赏 收藏 转发到动态 举报
写回复
用AI写文章
14 条回复
切换为时间正序
请发表友善的回复…
发表回复
小学工 2017-07-26
  • 打赏
  • 举报
回复
引用 1 楼 zhaoyu_m69 的回复:
推荐使用NPlot插件 获取实时数据添加到List里 然后显示曲线图
如何获取插件呢 NPlot这是个需要从官网下载的控件么 我的数据已经可以从list显示了
steel_yuan 2017-07-26
  • 打赏
  • 举报
回复
学习学习我也需要
Haou2020 2017-07-26
  • 打赏
  • 举报
回复
推荐使用NPlot插件 获取实时数据添加到List里 然后显示曲线图
小学工 2017-07-26
  • 打赏
  • 举报
回复
引用 10 楼 ilikeff8 的回复:
[quote=引用 7 楼 qq_38606415 的回复:] [quote=引用 4 楼 ilikeff8 的回复:] 如果用picturebox控件的话 是不能显示 xy轴的 包括值和定义上限下限 我想呈现出这种效果的图
winform不是自带chart控件么, 如果要更专业的效果,可以用devExpress控件包里[/quote] 就是这个chart控件在我的工具箱里没有 如何调出来
小学工 2017-07-26
  • 打赏
  • 举报
回复
引用 12 楼 zhaoyu_m69 的回复:
[quote=引用 11 楼 qq_38606415 的回复:] [quote=引用 6 楼 zhaoyu_m69 的回复:] [quote=引用 3 楼 qq_38606415 的回复:] [quote=引用 1 楼 zhaoyu_m69 的回复:] 推荐使用NPlot插件 获取实时数据添加到List里 然后显示曲线图
如何获取插件呢 NPlot这是个需要从官网下载的控件么 我的数据已经可以从list显示了[/quote] 下载一个dll 引用 在工具箱里添加控件 直接拖过来使用[/quote] 大神 我听不太懂 下载一个什么dll的文件 能具体说一下么 新手不是太懂 我是在winform窗口下开发的[/quote] 百度一下,你就知道[/quote] 谢谢 我学习一下
Haou2020 2017-07-26
  • 打赏
  • 举报
回复
引用 11 楼 qq_38606415 的回复:
[quote=引用 6 楼 zhaoyu_m69 的回复:] [quote=引用 3 楼 qq_38606415 的回复:] [quote=引用 1 楼 zhaoyu_m69 的回复:] 推荐使用NPlot插件 获取实时数据添加到List里 然后显示曲线图
如何获取插件呢 NPlot这是个需要从官网下载的控件么 我的数据已经可以从list显示了[/quote] 下载一个dll 引用 在工具箱里添加控件 直接拖过来使用[/quote] 大神 我听不太懂 下载一个什么dll的文件 能具体说一下么 新手不是太懂 我是在winform窗口下开发的[/quote] 百度一下,你就知道
小学工 2017-07-26
  • 打赏
  • 举报
回复
引用 6 楼 zhaoyu_m69 的回复:
[quote=引用 3 楼 qq_38606415 的回复:] [quote=引用 1 楼 zhaoyu_m69 的回复:] 推荐使用NPlot插件 获取实时数据添加到List里 然后显示曲线图
如何获取插件呢 NPlot这是个需要从官网下载的控件么 我的数据已经可以从list显示了[/quote] 下载一个dll 引用 在工具箱里添加控件 直接拖过来使用[/quote] 大神 我听不太懂 下载一个什么dll的文件 能具体说一下么 新手不是太懂 我是在winform窗口下开发的
ilikeff8 2017-07-26
  • 打赏
  • 举报
回复
引用 7 楼 qq_38606415 的回复:
[quote=引用 4 楼 ilikeff8 的回复:] 如果用picturebox控件的话 是不能显示 xy轴的 包括值和定义上限下限 我想呈现出这种效果的图
winform不是自带chart控件么, 如果要更专业的效果,可以用devExpress控件包里
Haou2020 2017-07-26
  • 打赏
  • 举报
回复

        private void dispplot(NPlot.Windows.PlotSurface2D myplot, List<float> mlist,double dmax,double dmin)
        {
            int[] myxx = new int[2048];
            float[] myyy = new float[2048];

            myplot.Clear();

            Grid mygrid = new Grid();
            mygrid.HorizontalGridType = Grid.GridType.None;
            mygrid.VerticalGridType = Grid.GridType.Fine;
            myplot.Add(mygrid);

            for (int i = 0; i < 2048; i++)
            {
                myxx[i] = i;
            }
            myyy = mlist.ToArray();

            LinePlot lp = new LinePlot();
            lp.Pen = new Pen(Color.Red, 1);
            lp.AbscissaData = myxx;
            lp.OrdinateData = myyy;
            myplot.Add(lp);

            LinearAxis liny = (LinearAxis)myplot.YAxis1;
            liny.WorldMax = dmax;
            liny.WorldMin = dmin;
            myplot.YAxis1 = liny;

            myplot.Refresh();
        }
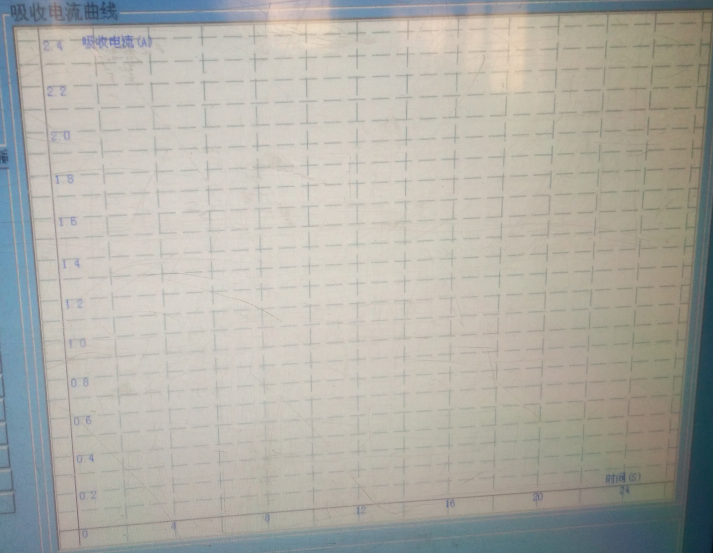
参考下
小学工 2017-07-26
  • 打赏
  • 举报
回复
小学工 2017-07-26
  • 打赏
  • 举报
回复
引用 4 楼 ilikeff8 的回复:
假设你用的是winform

using System;
using System.Collections.Generic;
using System.ComponentModel;
using System.Data;
using System.Drawing;
using System.Linq;
using System.Text;
using System.Threading;
using System.Threading.Tasks;
using System.Windows.Forms;

namespace WindowsFormsApplication5
{
    public partial class Form1 : Form
    {
        List<int> values = new List<int>();
        Bitmap bitmap = null;
        PictureBox pictureBox = null;
        int totalShowPointNumber = 30;

        public Form1()
        {
            InitializeComponent();
            pictureBox = new PictureBox
            {
                Parent = this,
                Dock = DockStyle.Fill
            };

            ThreadPool.QueueUserWorkItem(obj =>
            {
                Random random = new Random();
                values.Add(0);

                while (true)
                {
                    try
                    {
                        bitmap = new Bitmap(pictureBox.Width, pictureBox.Height);

                        int newValue = random.Next(pictureBox.Height);
                        values.Add(newValue);

                        int start = values.Count - totalShowPointNumber;
                        if (start < 0)
                            start = 0;

                        List<Point> pointList = new List<Point>();

                        for (int i = start; i < values.Count; i++)
                        {
                            pointList.Add(new Point((i- start )* pictureBox.Width/totalShowPointNumber, values[i]));
                        }

                        using (Graphics graphics = Graphics.FromImage(bitmap))
                        {
                            graphics.DrawLines(Pens.Red, pointList.ToArray());
                        }

                        pictureBox.Invoke((Action)(() =>
                        {
                            pictureBox.Image = bitmap;
                        }));

                        Thread.Sleep(100);
                    }
                    catch
                    {
                    }
                }
            });
        }
    }
}
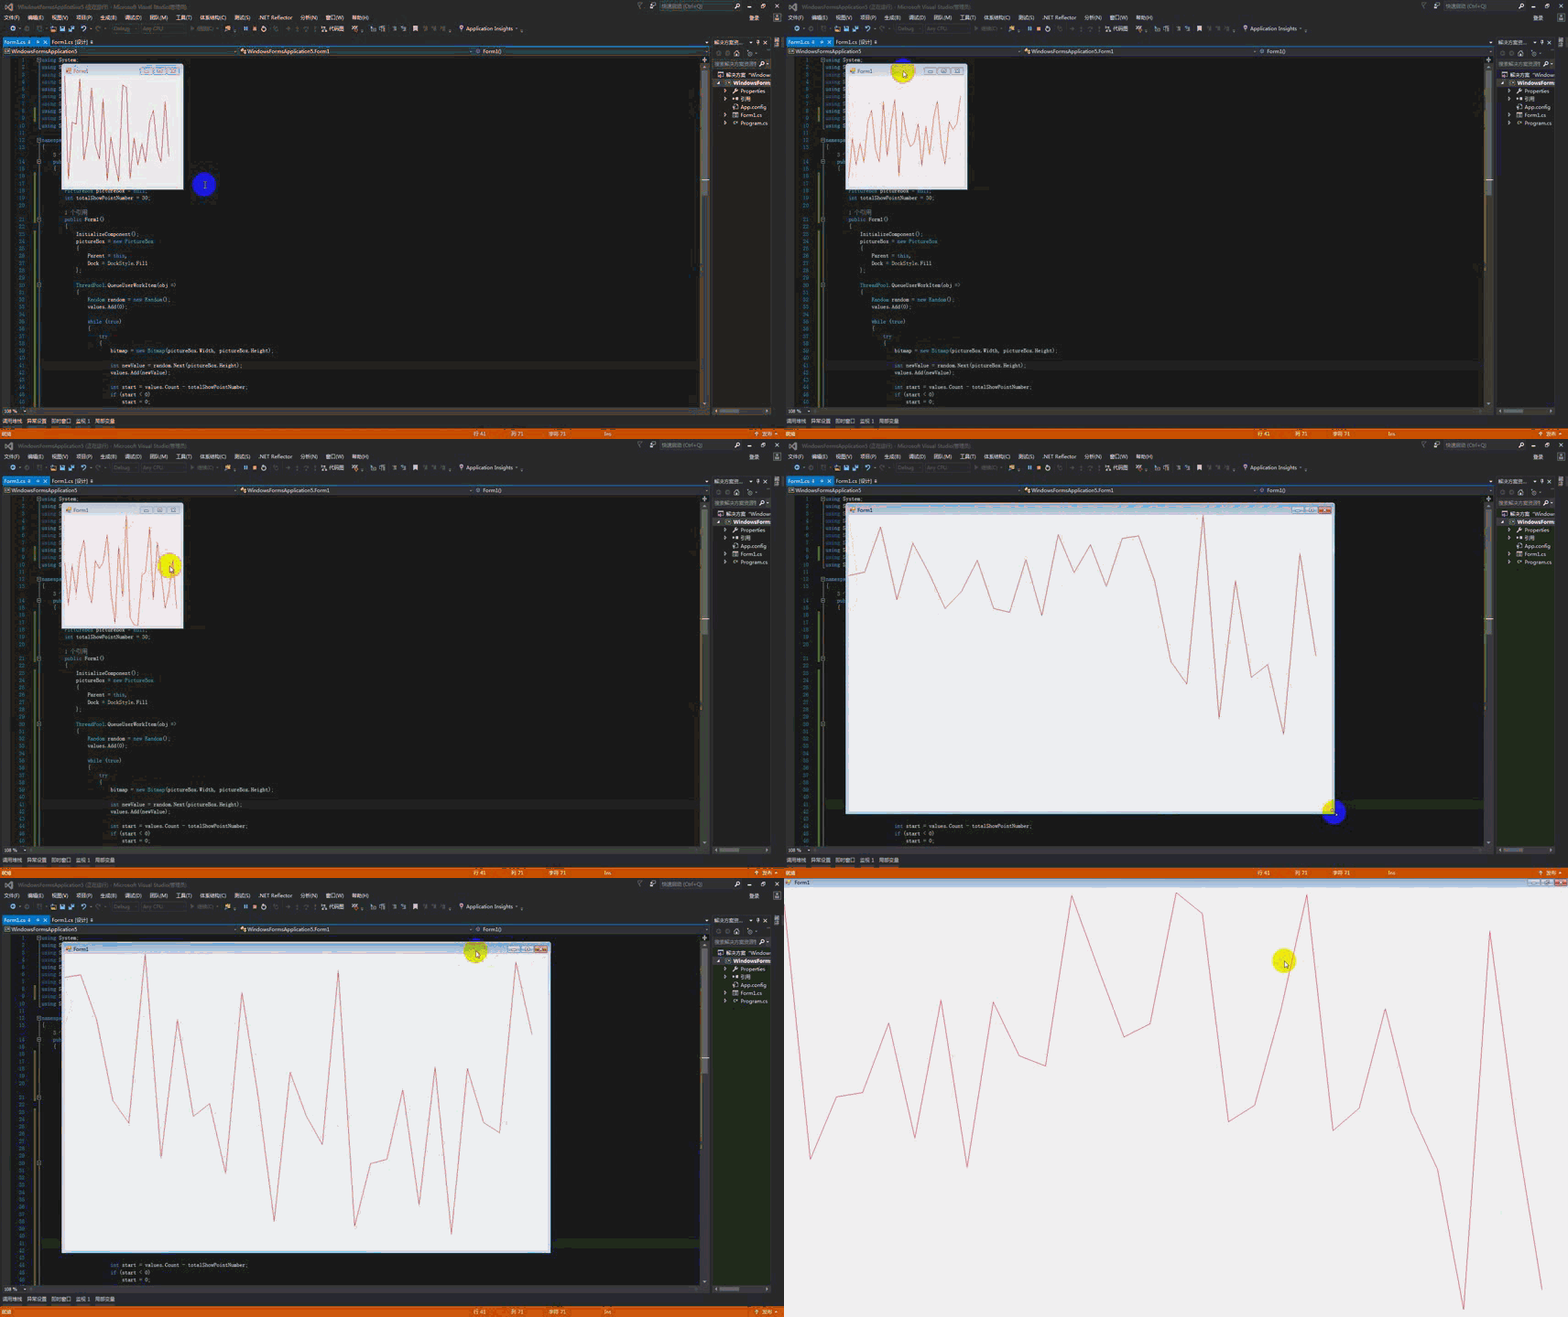
如果用picturebox控件的话 是不能显示 xy轴的 包括值和定义上限下限 我想呈现出这种效果的图
Haou2020 2017-07-26
  • 打赏
  • 举报
回复
引用 3 楼 qq_38606415 的回复:
[quote=引用 1 楼 zhaoyu_m69 的回复:] 推荐使用NPlot插件 获取实时数据添加到List里 然后显示曲线图
如何获取插件呢 NPlot这是个需要从官网下载的控件么 我的数据已经可以从list显示了[/quote] 下载一个dll 引用 在工具箱里添加控件 直接拖过来使用
qq_29583345 2017-07-26
  • 打赏
  • 举报
回复
Zedgraph
ilikeff8 2017-07-26
  • 打赏
  • 举报
回复
假设你用的是winform


using System;
using System.Collections.Generic;
using System.ComponentModel;
using System.Data;
using System.Drawing;
using System.Linq;
using System.Text;
using System.Threading;
using System.Threading.Tasks;
using System.Windows.Forms;

namespace WindowsFormsApplication5
{
public partial class Form1 : Form
{
List<int> values = new List<int>();
Bitmap bitmap = null;
PictureBox pictureBox = null;
int totalShowPointNumber = 30;

public Form1()
{
InitializeComponent();
pictureBox = new PictureBox
{
Parent = this,
Dock = DockStyle.Fill
};

ThreadPool.QueueUserWorkItem(obj =>
{
Random random = new Random();
values.Add(0);

while (true)
{
try
{
bitmap = new Bitmap(pictureBox.Width, pictureBox.Height);

int newValue = random.Next(pictureBox.Height);
values.Add(newValue);

int start = values.Count - totalShowPointNumber;
if (start < 0)
start = 0;

List<Point> pointList = new List<Point>();

for (int i = start; i < values.Count; i++)
{
pointList.Add(new Point((i- start )* pictureBox.Width/totalShowPointNumber, values[i]));
}

using (Graphics graphics = Graphics.FromImage(bitmap))
{
graphics.DrawLines(Pens.Red, pointList.ToArray());
}

pictureBox.Invoke((Action)(() =>
{
pictureBox.Image = bitmap;
}));

Thread.Sleep(100);
}
catch
{
}
}
});
}
}
}


110,538

社区成员

发帖
与我相关
我的任务
社区描述
.NET技术 C#
社区管理员
  • C#
  • Web++
  • by_封爱
加入社区
  • 近7日
  • 近30日
  • 至今
社区公告

让您成为最强悍的C#开发者

试试用AI创作助手写篇文章吧