

87,988
社区成员
 发帖
发帖 与我相关
与我相关 我的任务
我的任务
 分享
分享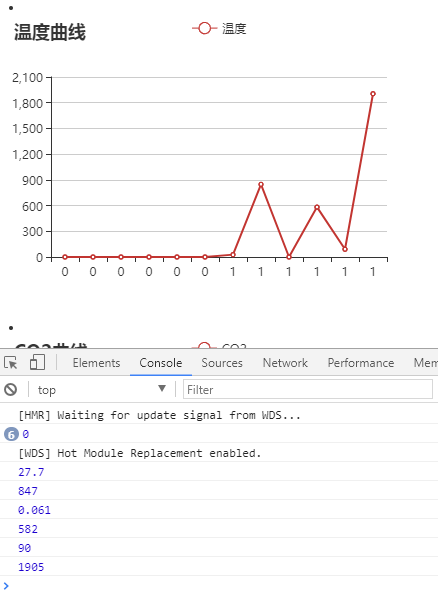
import React,{Component} from 'react';

import ReactEcharts from 'echarts-for-react';

import TestComp from './testcomponent';


var io = require('socket.io-client');

var socket = io.connect('http://localhost',{'forceNew':true});


export default class Test extends Component{

    constructor(props){

        super(props);

        this.state={

            sensorData:[0,0,0,0,0,0],

            count:0

        }

    }


    componentDidMount(){

        socket.on('sensordata_server', function (data) {

            this.setState({

                sensorData:[data.temp,data.humi,data.ch2o,data.co2,data.pm2d5,data.voc],

                count:this.state.count+1

            })

        }.bind(this));

    }


    render(){

        return(

            <div>

                {this.state.sensorData.map(function(item,index){

                    console.log(item);

                    return(

                        <TestComp sensorData={item} count={this.state.count} key={index} index={index}/>

                    )

                }.bind(this))}

            </div>

        )

    }

}
import React,{Component} from 'react';

import ReactEcharts from 'echarts-for-react';


var xAxisData = [];

var seriesData = [];


export default class TestComp extends Component{

    constructor(props){

        super(props);

        this.state={

            sensorData:props.sensorData,

            count:props.count

        }

    }


    render(){

        return(

            <li className="col-md-4">

                <ReactEcharts

                    option={this.Option()}

                    notMerge={true}

                    lazyUpdate={true}

                    onChartReady={this.onChartReadyCallback}

                />

            </li>

        )

    }


    componentWillReceiveProps(nextProps) {

        this.setState({

            sensorData:nextProps.sensorData,

            count:nextProps.count

        });

    }


    Option(){

        let temp_option = {

            title:{

                text:'温度曲线'

            },

            tooltip:{


            },

            legend: {

                data:['温度']

            },

            xAxis:{

                data: (function (){

                    xAxisData.push(this.state.count);

                    return xAxisData;

                }.bind(this))()

            },

            yAxis: {},

            series:{

                name:'温度',

                type:'line',

                data:(function (){

                    seriesData.push(this.state.sensorData);

                    return seriesData;

                }.bind(this))()

            }

        }


        let humi_option = {

            title:{

                text:'湿度曲线'

            },

            tooltip:{


            },

            legend: {

                data:['湿度']

            },

            xAxis:{

                data:['1','2','3','4','5','6','7','8','9','10']

            },

            yAxis: {},

            series:{

                name:'湿度',

                type:'line',

                data:[5, 20, 36, 10, 10, 20, 100, 30, 47, 58]

            }

        }


        let ch2o_option = {

            title:{

                text:'甲醛曲线'

            },

            tooltip:{


            },

            legend: {

                data:['甲醛']

            },

            xAxis:{

                data:['1','2','3','4','5','6','7','8','9','10']

            },

            yAxis: {},

            series:{

                name:'甲醛',

                type:'line',

                data: [5, 20, 36, 10, 10, 20, 100, 30, 47, 58]

            }

        }


        let co2_option = {

            title:{

                text:'CO2曲线'

            },

            tooltip:{


            },

            legend: {

                data:['CO2']

            },

            xAxis:{

                data:['1','2','3','4','5','6','7','8','9','10']

            },

            yAxis: {},

            series:{

                name:'CO2',

                type:'line',

                data: [5, 20, 36, 10, 10, 20, 100, 30, 47, 58]

            }

        }


        let pm2d5_option = {

            title:{

                text:'PM2.5曲线'

            },

            tooltip:{


            },

            legend: {

                data:['PM2.5']

            },

            xAxis:{

                data:['1','2','3','4','5','6','7','8','9','10']

            },

            yAxis: {},

            series:{

                name:'PM2.5',

                type:'line',

                data: [5, 20, 36, 10, 10, 20, 100, 30, 47, 58]

            }

        }


        let voc_option = {

            title:{

                text:'VOC曲线'

            },

            tooltip:{


            },

            legend: {

                data:['VOC']

            },

            xAxis:{

                data:['1','2','3','4','5','6','7','8','9','10']

            },

            yAxis: {},

            series:{

                name:'VOC',

                type:'line',

                data: [5, 20, 36, 10, 10, 20, 100, 30, 47, 58]

            }

        }


        switch(this.props.index){

            case 0 : return temp_option;

            case 1 : return humi_option;

            case 2 : return ch2o_option;

            case 3 : return co2_option;

            case 4 : return pm2d5_option;

            case 5 : return voc_option;

        }

    }

}


xAxisData.push(this.state.count);
return xAxisData;
xAxisData[this.props.index] = xAxisData[this.props.index] || [];
xAxisData[this.props.index].push(this.state.count);
return xAxisData[this.props.index];
seriesData.push(this.state.sensorData);
return seriesData;seriesData[this.props.index] = seriesData[this.props.index] || [];
seriesData[this.props.index].push(this.state.sensorData);
return seriesData[this.props.index];

