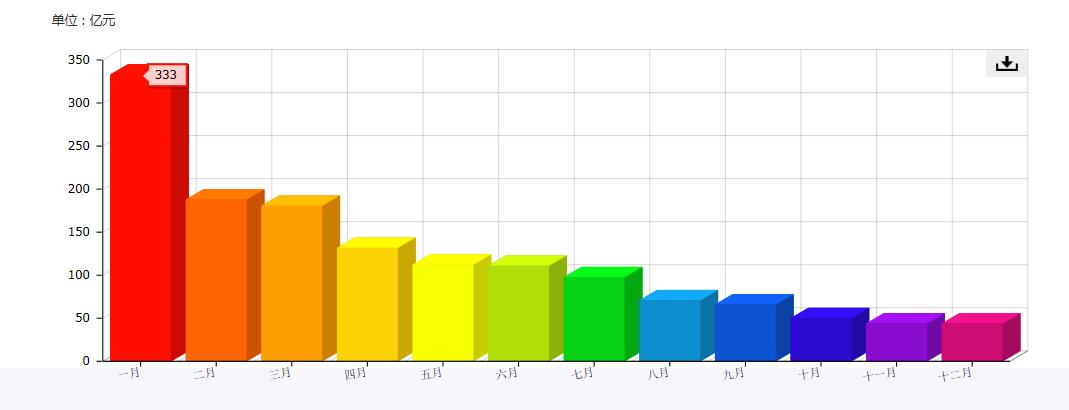
通过jQuery或者js制作amcharts(AmCharts)图表如何给每个柱状图添加链接或者点击事件,感觉很难做,谢谢大家

百度账户不忍被抛弃 2017-12-02 10:05:28
系统能正常运行。

我的图表是这样的:


页面引用:


js代码:
单位:亿元
<div id="chartdiv" style="height: 350px;"></div>
<div id="taxNO">333</div>

<script type="text/javascript">
var chart;
var yiyue = $("#taxNO").text();
var chartData = [{
"country": "一月",
"visits": yiyue,
"color": "#FF0F00"

}, {
"country": "二月",
"visits": 188,
"color": "#FF6600"
}, {
"country": "三月",
"visits": 180,
"color": "#FF9E01"
}, {
"country": "四月",
"visits": 132,
"color": "#FCD202"
}, {
"country": "五月",
"visits": 112,
"color": "#F8FF01"
}, {
"country": "六月",
"visits": 111,
"color": "#B0DE09"
}, {
"country": "七月",
"visits": 98,
"color": "#04D215"
}, {
"country": "八月",
"visits": 71,
"color": "#0D8ECF"
}, {
"country": "九月",
"visits": 66,
"color": "#0D52D1"
}, {
"country": "十月",
"visits": 50,
"color": "#2A0CD0"
}, {
"country": "十一月",
"visits": 44,
"color": "#8A0CCF"
}, {
"country": "十二月",
"visits": 44,
"color": "#CD0D74"
}];


var chart = AmCharts.makeChart("chartdiv", {
type: "serial",
dataProvider: chartData,
categoryField: "country",
depth3D: 20,//3D效果的厚度
angle: 30,//3D效果的倾斜度

categoryAxis: {
labelRotation: 10,//月份显示宽度
gridPosition: "start"
},

valueAxes: [{
title: "",
}],

graphs: [{

valueField: "visits",
colorField: "color",
type: "column",
lineAlpha: 0,
fillAlphas: 1
}],

chartCursor: {
cursorAlpha: 0,
zoomable: false,
categoryBalloonEnabled: false
},

exportConfig: {
menuTop: "21px",
menuBottom: "auto",
menuRight: "21px",
backgroundColor: "#efefef",

menuItemStyle: {
backgroundColor: '#EFEFEF',
rollOverBackgroundColor: '#DDDDDD'
},

menuItems: [{
textAlign: 'center',
icon: '../amcharts/images/export.png',
onclick: function () { },
items: [{
title: 'JPG',
format: 'jpg'
}, {
title: 'PNG',
format: 'png'
}, {
title: 'SVG',
format: 'svg'
}, {
title: 'PDF',
format: 'pdf'
}]
}]
}
});
</script>
...全文
376 4 打赏 收藏 转发到动态 举报
AI 作业
写回复
用AI写文章
4 条回复
切换为时间正序
请发表友善的回复…
发表回复
Hello World, 2017-12-04
  • 打赏
  • 举报
回复
<!DOCTYPE html>
<html>
<head>
    <meta http-equiv="Content-Type" content="text/html; charset=utf-8" />
    <title></title>
    <meta charset="utf-8" />
</head>
<body>
    <!-- Styles -->
    <style>
        #chartdiv {
            width: 100%;
            height: 500px;
        }

        .amcharts-export-menu-top-right {
            top: 10px;
            right: 0;
        }
    </style>

    <!-- Resources -->
    <script src="https://www.amcharts.com/lib/3/amcharts.js"></script>
    <script src="https://www.amcharts.com/lib/3/serial.js"></script>
    <script src="https://www.amcharts.com/lib/3/plugins/export/export.min.js"></script>
    <link rel="stylesheet" href="https://www.amcharts.com/lib/3/plugins/export/export.css" type="text/css" media="all" />
    <script src="https://www.amcharts.com/lib/3/themes/light.js"></script>

    <!-- Chart code -->
    <script>
        var chart = AmCharts.makeChart("chartdiv", {
            "type": "serial",
            "theme": "light",
            "marginRight": 70,
            "dataProvider": [{
                "country": "USA",
                "visits": 3025,
                "color": "#FF0F00"
            }, {
                "country": "China",
                "visits": 1882,
                "color": "#FF6600"
            }, {
                "country": "Japan",
                "visits": 1809,
                "color": "#FF9E01"
            }, {
                "country": "Germany",
                "visits": 1322,
                "color": "#FCD202"
            }, {
                "country": "UK",
                "visits": 1122,
                "color": "#F8FF01"
            }, {
                "country": "France",
                "visits": 1114,
                "color": "#B0DE09"
            }, {
                "country": "India",
                "visits": 984,
                "color": "#04D215"
            }, {
                "country": "Spain",
                "visits": 711,
                "color": "#0D8ECF"
            }, {
                "country": "Netherlands",
                "visits": 665,
                "color": "#0D52D1"
            }, {
                "country": "Russia",
                "visits": 580,
                "color": "#2A0CD0"
            }, {
                "country": "South Korea",
                "visits": 443,
                "color": "#8A0CCF"
            }, {
                "country": "Canada",
                "visits": 441,
                "color": "#CD0D74"
            }],
            "valueAxes": [{
                "axisAlpha": 0,
                "position": "left",
                "title": "Visitors from country"
            }],
            "startDuration": 1,
            "graphs": [{
                "balloonText": "<b>[[category]]: [[value]]</b>",
                "fillColorsField": "color",
                "fillAlphas": 0.9,
                "lineAlpha": 0.2,
                "type": "column",
                "valueField": "visits"
            }],
            "chartCursor": {
                "categoryBalloonEnabled": false,
                "cursorAlpha": 0,
                "zoomable": false
            },
            "categoryField": "country",
            "categoryAxis": {
                "gridPosition": "start",
                "labelRotation": 45
            },
            "export": {
                "enabled": true
            }

        });
        // add click listener
        chart.addListener("clickGraphItem", handleClick);
        function handleClick(event) {
            alert(event.item.category + ": " + event.item.values.value);
        }
    </script>
    <!-- HTML -->
    <div id="chartdiv"></div>
</body>
</html>
  • 打赏
  • 举报
回复
引用 2 楼 apollokk 的回复:
参考:https://docs.amcharts.com/3/javascriptcharts/AmPieChart#events
你好,能不能详细说明一下啊?作为新手,确实看不太明白啊?谢谢你了
  • 打赏
  • 举报
回复
这个功能应该是各种语言通用的把,请大家大神们帮帮忙!
Hello World, 2017-12-02
  • 打赏
  • 举报
回复
参考:https://docs.amcharts.com/3/javascriptcharts/AmPieChart#events

87,996

社区成员

发帖
与我相关
我的任务
社区描述
Web 开发 JavaScript
社区管理员
  • JavaScript
  • 无·法
加入社区
  • 近7日
  • 近30日
  • 至今
社区公告
暂无公告

试试用AI创作助手写篇文章吧