我的java程序出现了死锁情况
Caused by: java.sql.BatchUpdateException: Deadlock found when trying to get lock; try restarting transaction
但是在mysql的日志文件里面并没有体现死锁,请问这是什么情况
...全文
14208打赏收藏
mysql数据库出现了死锁,但是mysql的错误日志文件里面并没有记录
我的java程序出现了死锁情况 Caused by: java.sql.BatchUpdateException: Deadlock found when trying to get lock; try restarting transaction 但是在mysql的日志文件里面并没有体现死锁,请问这是什么情况
----------
OS WAIT ARRAY INFO: reservation count 319474, signal count 310963
Mutex spin waits 0, rounds 11978054, OS waits 121222
RW-shared spins 149691, OS waits 64878; RW-excl spins 191512, OS waits 120546
------------------------
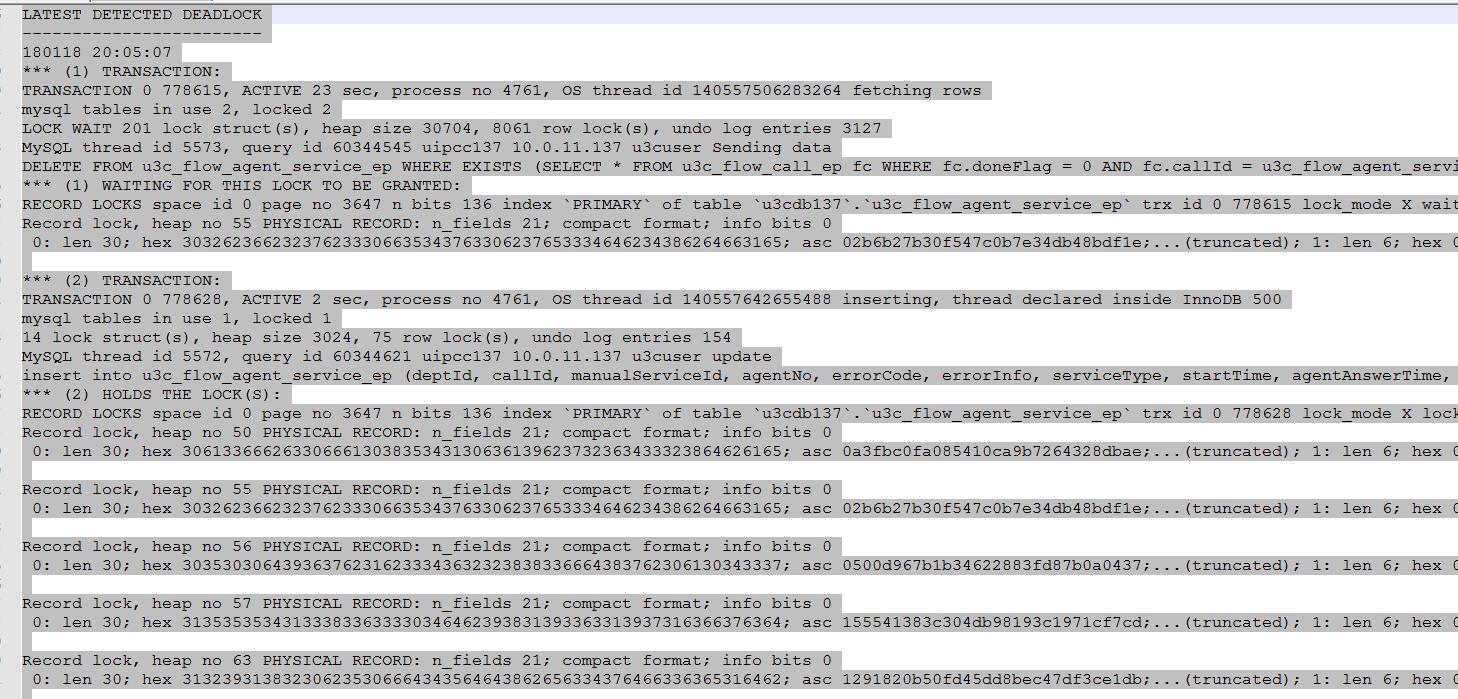
LATEST DETECTED DEADLOCK
------------------------
180209 2:10:18
*** (1) TRANSACTION:
TRANSACTION 0 1060691, ACTIVE 2 sec, process no 3065, OS thread id 140314801186560 inserting
mysql tables in use 1, locked 1
LOCK WAIT 3 lock struct(s), heap size 1216, 2 row lock(s), undo log entries 4
MySQL thread id 43, query id 32641224 uipcc137 10.0.11.137 u3cuser update
insert into u3c_flow_manual_service_ep (deptId, callId, startTime, endTime, queue, requestSkill, errorCode, errorInfo, agentNo, waitPeopleNum, serviceType, callType, isStatistics, line, sucAnswerTime, mediaType, agentServiceLength, validAgentServiceLength, manualServiceId) values ('102', '10.0.11.137_c242f935-7103-4f47-a8f9-7bf6d786f213', '2018-02-09 02:07:11', '2018-02-09 02:09:02', 'sip:400_organA@acd.u3c.com', '0', '0', '正常接听', 'sip:5043@u3c.com', 1, 0, 1, 1, 'sip:400_organA@acd.u3c.com', '2018-02-09 02:07:15', 1, 1, 1, '21ab1276551d41f1b76e14d3a2a3d1ca')
*** (1) WAITING FOR THIS LOCK TO BE GRANTED:
RECORD LOCKS space id 0 page no 6536 n bits 136 index `PRIMARY` of table `u3cdb137`.`u3c_flow_manual_service_ep` trx id 0 1060691 lock_mode X locks gap before rec insert intention waiting
Record lock, heap no 63
*** (2) TRANSACTION:
TRANSACTION 0 1060682, ACTIVE 16 sec, process no 3065, OS thread id 140314856933120 fetching rows, thread declared inside InnoDB 489
mysql tables in use 3, locked 3
514 lock struct(s), heap size 63472, 17242 row lock(s), undo log entries 715
MySQL thread id 44, query id 32639453 uipcc137 10.0.11.137 u3cuser Sending data
insert INTO flow_manual_service_temp SELECT fms.*,fc.terminalType FROM u3c_flow_manual_service_ep fms left join u3c_flow_call_ep fc on fc.callId=fms.callId WHERE fms.isStatistics=1 AND fc.doneFlag = 0 AND fc.startTime >= '2018-02-08 23:55:00' AND fc.startTime < '2018-02-09 00:00:00'
*** (2) HOLDS THE LOCK(S):
RECORD LOCKS space id 0 page no 6536 n bits 136 index `PRIMARY` of table `u3cdb137`.`u3c_flow_manual_service_ep` trx id 0 1060682 lock mode S
Record lock, heap no 1
Record lock, heap no 2
Record lock, heap no 5
Record lock, heap no 6
Record lock, heap no 7
Record lock, heap no 8
Record lock, heap no 11
Record lock, heap no 13
Record lock, heap no 14
Record lock, heap no 16
Record lock, heap no 17
Record lock, heap no 18
Record lock, heap no 19
Record lock, heap no 20
Record lock, heap no 21
Record lock, heap no 22
Record lock, heap no 23
Record lock, heap no 24
Record lock, heap no 25
Record lock, heap no 27
Record lock, heap no 28
Record lock, heap no 29
Record lock, heap no 30
Record lock, heap no 31
Record lock, heap no 32
Record lock, heap no 33
Record lock, heap no 34
Record lock, heap no 35
Record lock, heap no 36
Record lock, heap no 37
Record lock, heap no 38
Record lock, heap no 39
Record lock, heap no 40
Record lock, heap no 41
Record lock, heap no 42
Record lock, heap no 43
Record lock, heap no 44
Record lock, heap no 45
Record lock, heap no 46
Record lock, heap no 47
Record lock, heap no 56
Record lock, heap no 60
Record lock, heap no 61
Record lock, heap no 63
Record lock, heap no 64
Record lock, heap no 65
Record lock, heap no 66
*** (2) WAITING FOR THIS LOCK TO BE GRANTED:
RECORD LOCKS space id 0 page no 53506 n bits 136 index `PRIMARY` of table `u3cdb137`.`u3c_flow_manual_service_ep` trx id 0 1060682 lock mode S waiting
Record lock, heap no 52 PHYSICAL RECORD: n_fields 22; compact format; info bits 0
0: len 30; hex 616435363830373730656535343236626232343532303738633262353934; asc ad5680770ee5426bb2452078c2b594;...(truncated); 1: len 6; hex 000000102f53; asc /S;; 2: len 7; hex 800000d76c018e; asc l ;; 3: len 3; hex 313032; asc 102;; 4: len 30; hex 31302e302e31312e3133375f61393234393438632d303266622d34333739; asc 10.0.11.137_a924948c-02fb-4379;...(truncated); 5: len 8; hex 8000125a9230af26; asc Z 0 &;; 6: len 8; hex 8000125a9230afe5; asc Z 0 ;; 7: len 26; hex 7369703a3430305f6f7267616e41406163642e7533632e636f6d; asc sip:400_organA@acd.u3c.com;; 8: len 1; hex 30; asc 0;; 9: len 4; hex 80000000; asc ;; 10: len 12; hex e6ada3e5b8b8e68ea5e590ac; asc ;; 11: len 16; hex 7369703a35303432407533632e636f6d; asc sip:5042@u3c.com;; 12: len 4; hex 80000001; asc ;; 13: len 4; hex 80000000; asc ;; 14: len 4; hex 80000001; asc ;; 15: len 4; hex 80000001; asc ;; 16: len 26; hex 7369703a3430305f6f7267616e41406163642e7533632e636f6d; asc sip:400_organA@acd.u3c.com;; 17: len 8; hex 8000125a9230af2b; asc Z 0 +;; 18: len 4; hex 80000001; asc ;; 19: len 4; hex 80000001; asc ;; 20: len 4; hex 80000001; asc ;; 21: SQL NULL;
*** WE ROLL BACK TRANSACTION (1)
------------
TRANSACTIONS
------------
Trx id counter 0 1071961
Purge done for trx's n:o < 0 1071960 undo n:o < 0 0
History list length 1
LIST OF TRANSACTIONS FOR EACH SESSION:
---TRANSACTION 0 0, not started, process no 3065, OS thread id 140314801186560
MySQL thread id 90, query id 64572950 localhost u3cuser
show innodb status
---TRANSACTION 0 1071958, not started, process no 3065, OS thread id 140314857199360
MySQL thread id 89, query id 64572741 uipcc137 10.0.11.137 u3cuser
---TRANSACTION 0 1071953, not started, process no 3065, OS thread id 140314801452800
MySQL thread id 85, query id 64571981 uipcc137 10.0.11.137 u3cuser
---TRANSACTION 0 1071957, not started, process no 3065, OS thread id 140314801719040
MySQL thread id 86, query id 64572520 uipcc137 10.0.11.137 u3cuser
---TRANSACTION 0 1071955, not started, process no 3065, OS thread id 140314857731840
MySQL thread id 79, query id 64572782 uipcc137 10.0.11.137 u3cuser
---TRANSACTION 0 1071960, ACTIVE 1 sec, process no 3065, OS thread id 140314856933120 starting index read, thread declared inside InnoDB 500
mysql tables in use 1, locked 1
56 lock struct(s), heap size 6752, 57 row lock(s), undo log entries 132
MySQL thread id 78, query id 64572983 uipcc137 10.0.11.137 u3cuser Updating
update u3c_flow_agent_service_ep set endTime='2018-02-09 09:27:40' where agentServiceId='8a0924cabc984dedbe6f885bb1cadabd'
Trx read view will not see trx with id >= 0 1071961, sees < 0 1071961
--------
FILE I/O
--------
I/O thread 0 state: waiting for i/o request (insert buffer thread)
I/O thread 1 state: waiting for i/o request (log thread)
I/O thread 2 state: waiting for i/o request (read thread)
I/O thread 3 state: waiting for i/o request (write thread)
Pending normal aio reads: 0, aio writes: 0,
ibuf aio reads: 0, log i/o's: 0, sync i/o's: 0
Pending flushes (fsync) log: 0; buffer pool: 0
2679123 OS file reads, 2697048 OS file writes, 325394 OS fsyncs
59.98 reads/s, 16384 avg bytes/read, 72.31 writes/s, 4.33 fsyncs/s
-------------------------------------
INSERT BUFFER AND ADAPTIVE HASH INDEX
-------------------------------------
Ibuf: size 13, free list len 189, seg size 203,
2449226 inserts, 2447302 merged recs, 1014306 merges
Hash table size 17393, node heap has 2 buffer(s)
30.32 hash searches/s, 506.50 non-hash searches/s
---
LOG
---
Log sequence number 3 2753226858
Log flushed up to 3 2753147852
Last checkpoint at 3 2751844660
0 pending log writes, 0 pending chkp writes
185385 log i/o's done, 2.33 log i/o's/second
----------------------
BUFFER POOL AND MEMORY
----------------------
Total memory allocated 20948474; in additional pool allocated 1047296
Dictionary memory allocated 265952
Buffer pool size 512
Free buffers 42
Database pages 468
Modified db pages 394
Pending reads 0
Pending writes: LRU 0, flush list 0, single page 0
Pages read 2905475, created 94986, written 3059651
59.98 reads/s, 1.67 creates/s, 74.31 writes/s
Buffer pool hit rate 964 / 1000
--------------
ROW OPERATIONS
--------------
0 queries inside InnoDB, 0 queries in queue
2 read views open inside InnoDB
Main thread process no. 3065, id 140314812208896, state: sleeping
Number of rows inserted 3016208, updated 782299, deleted 577927, read 147084936
83.64 inserts/s, 24.33 updates/s, 0.00 deletes/s, 76.64 reads/s
----------------------------
END OF INNODB MONITOR OUTPUT
============================
1 row in set, 1 warning (0.18 sec)
这是死锁日志


 发帖
发帖 与我相关
与我相关 我的任务
我的任务
 分享
分享