87,995
社区成员
 发帖
发帖 与我相关
与我相关 我的任务
我的任务 分享
分享

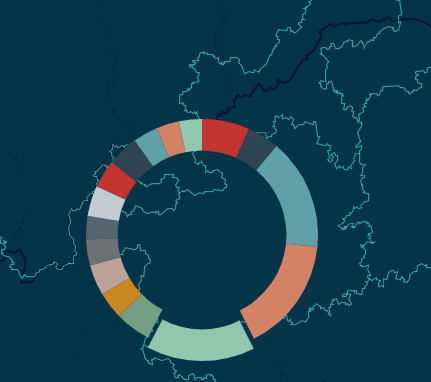
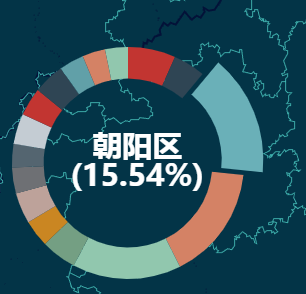
const myChart_pie = echarts.init(document.getElementById('main_pie'));

var canvas = document.createElement('canvas');

var count = 0;

var data = this.data;

		const option_pie = {

    series: [

        {

            type:'pie',

            radius: [0, '0%'],

            label: {

                normal: {

                    show: false

                }

            },

            labelLine: {

                normal: {

                    show: false

                }

            },

            data:data

        },

        {

            type:'pie',

            radius: ['40%', '55%'],

            avoidLabelOverlap: false,

            label: {

                normal: {

                    show: false,

                    position: 'center'

                },

                emphasis: {

                    show: true,

                    textStyle: {

                        fontSize: '30',

                        fontWeight: 'bold'

                    },

                    color: '#fff',

                    formatter: "{b}\n({d}%)"

                }

            },

            data:data

        }]

};

setInterval (function() {

    var r = count % data.length;

    option_pie.series[0].data[r].selected = false;

    option_pie.series[1].data[r].selected = false;

    count++;

    var s = count % data.length;

    option_pie.series[0].data[s].selected = true;

    option_pie.series[1].data[s].selected = true;

    myChart_pie.setOption(option_pie,true);

}, 1000);
app.title = '环形图';

option = {
    tooltip: {
        trigger: 'item',
        formatter: "{a} <br/>{b}: {c} ({d}%)"
    },
    legend: {
        orient: 'vertical',
        x: 'left',
        data:['直接访问','邮件营销','联盟广告','视频广告','搜索引擎']
    },
    series: [
        {
            name:'访问来源',
            type:'pie',
            radius: ['50%', '70%'],
            avoidLabelOverlap: false,
            label: {
                normal: {
                    show: false,
                    position: 'center'
                },
                emphasis: {
                    show: true,
                    textStyle: {
                        fontSize: '30',
                        fontWeight: 'bold'
                    }
                }
            },
            labelLine: {
                normal: {
                    show: false
                }
            },
            data:[
                {value:335, name:'直接访问'},
                {value:310, name:'邮件营销'},
                {value:234, name:'联盟广告'},
                {value:135, name:'视频广告'},
                {value:548, name:'搜索引擎'}
            ]
        }
    ]
};

var index = 0, prev = -1, max = 5;
setInterval(function(){
    if(prev >= 0){
        myChart.dispatchAction({
            type: 'pieUnSelect',
            seriesIndex: 0,
            dataIndex: prev
        });
    }
    myChart.dispatchAction({
        type: 'pieSelect',
        seriesIndex: 0,
        dataIndex: index
    });
    myChart.dispatchAction({
        type: 'showTip',
        seriesIndex: 0,
        dataIndex: index
    });
    prev = index;
    if(++index >= max){
        index = 0;
    }
}, 1000);