一个问题:python 无法输出图片
import pandas as pd
import matplotlib.pyplot as plt
import seaborn as sb
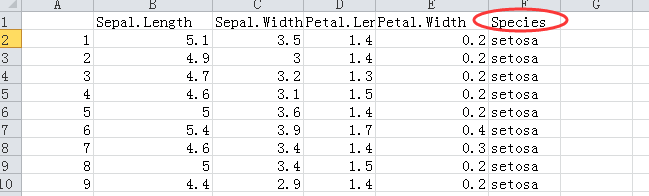
iris_data=pd.read_csv('I:\利用python 进行数据分析\iris-data.csv',na_values='NaN')
print(iris_data.head(10))
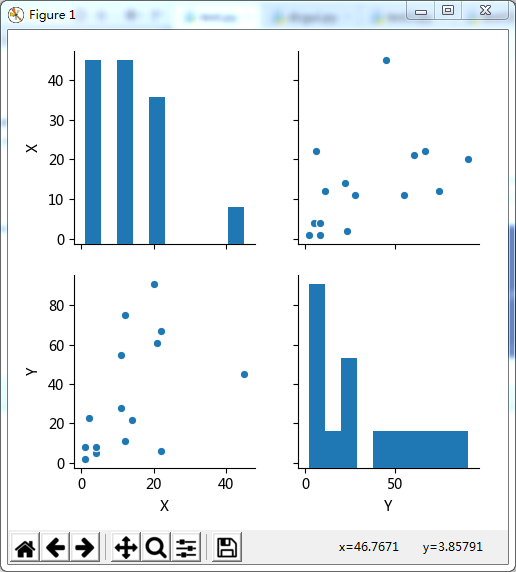
sb.pairplot(iris_data.dropna())
sb.pairplot(iris_data.dropna(),hue='class')
plt.show()
ValueError Traceback (most recent call last)
<ipython-input-25-b3a8928ea494> in <module>
----> 1 sb.pairplot(a,hue='class',plot_kws=False)
c:\users\administrator\appdata\local\programs\python\python37-32\lib\site-packages\seaborn\axisgrid.py in pairplot(data, hue, hue_order, palette, vars, x_vars, y_vars, kind, diag_kind, markers, height, aspect, dropna, plot_kws, diag_kws, grid_kws, size)
2109 diag_kws.setdefault("shade", True)
2110 diag_kws["legend"] = False
-> 2111 grid.map_diag(kdeplot, **diag_kws)
2112
2113 # Maybe plot on the off-diagonals
c:\users\administrator\appdata\local\programs\python\python37-32\lib\site-packages\seaborn\axisgrid.py in map_diag(self, func, **kwargs)
1397 color = fixed_color
1398
-> 1399 func(data_k, label=label_k, color=color, **kwargs)
1400
1401 self._clean_axis(ax)
c:\users\administrator\appdata\local\programs\python\python37-32\lib\site-packages\seaborn\distributions.py in kdeplot(data, data2, shade, vertical, kernel, bw, gridsize, cut, clip, legend, cumulative, shade_lowest, cbar, cbar_ax, cbar_kws, ax, **kwargs)
689 ax = _univariate_kdeplot(data, shade, vertical, kernel, bw,
690 gridsize, cut, clip, legend, ax,
--> 691 cumulative=cumulative, **kwargs)
692
693 return ax
c:\users\administrator\appdata\local\programs\python\python37-32\lib\site-packages\seaborn\distributions.py in _univariate_kdeplot(data, shade, vertical, kernel, bw, gridsize, cut, clip, legend, ax, cumulative, **kwargs)
292 "only implemented in statsmodels."
293 "Please install statsmodels.")
--> 294 x, y = _scipy_univariate_kde(data, bw, gridsize, cut, clip)
295
296 # Make sure the density is nonnegative
c:\users\administrator\appdata\local\programs\python\python37-32\lib\site-packages\seaborn\distributions.py in _scipy_univariate_kde(data, bw, gridsize, cut, clip)
364 """Compute a univariate kernel density estimate using scipy."""
365 try:
--> 366 kde = stats.gaussian_kde(data, bw_method=bw)
367 except TypeError:
368 kde = stats.gaussian_kde(data)
c:\users\administrator\appdata\local\programs\python\python37-32\lib\site-packages\scipy\stats\kde.py in __init__(self, dataset, bw_method, weights)
193 self.dataset = atleast_2d(dataset)
194 if not self.dataset.size > 1:
--> 195 raise ValueError("`dataset` input should have multiple elements.")
196
197 self.d, self.n = self.dataset.shape
ValueError: `dataset` input should have multiple elements.
报错信息如上,我照着github里写的,链接:https://github.com/rhiever/Data-Analysis-and-Machine-Learning-Projects/blob/master/example-data-science-notebook/Example%20Machine%20Learning%20Notebook.ipynb
读取csv文件并用图展示,但不知道什么情况,一直报错,搞了一晚上!还是没解决,头大,大神们来看看吧


 发帖
发帖 与我相关
与我相关 我的任务
我的任务
 分享
分享
 那这么写即可