1,453
社区成员
 发帖
发帖 与我相关
与我相关 我的任务
我的任务
 分享
分享 ?
?


Option Explicit
Private Type POINTAPI
x As Long
y As Long
End Type
Private Declare Function PolyBezier& Lib "gdi32" (ByVal hdc As Long, lppt As POINTAPI, ByVal cPoints As Long)
Private Sub Command1_Click()
Dim hdc As Long
Dim n As Long
Dim i As Long
Dim colP As New Collection
Dim aryPoint() As POINTAPI
'随机产生n个点,这里取n=8,生成Y坐标,X坐标按picture宽度平均
For n = 1 To 8
colP.Add Picture1.ScaleHeight * Rnd * 0.9
Next
Picture1.Cls
Picture1.CurrentX = 0
Picture1.CurrentY = Picture1.ScaleHeight - colP(1)
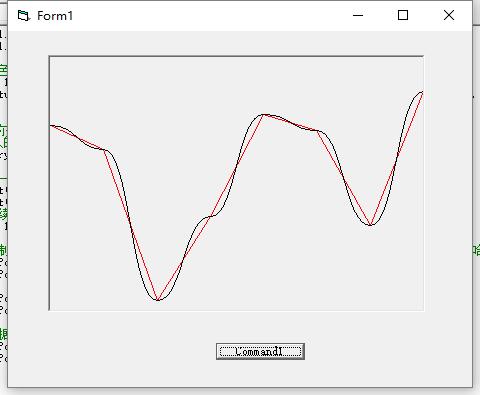
'画根红色的折线图作为比较
For i = 1 To colP.Count
Picture1.Line -(Picture1.ScaleWidth / 7 * (i - 1), Picture1.ScaleHeight - colP(i)), vbRed
Next
'画贝塞尔曲线
'API传入的点 为第一个点是起点,接下来三个一组,包括两个控件点和一个终点
ReDim aryPoint((colP.Count - 1) * 3)
'设置第一个点
aryPoint(0).x = 0
aryPoint(0).y = Picture1.ScaleHeight - colP(1)
'设置后续点
For i = 1 To colP.Count - 1
'控制点 两个控制点的X坐标都是两个数据点的中间,Y坐标分别与数据点相同。这是我的方案哈,你也可以自己调整控制点
aryPoint((i - 1) * 3 + 1).x = Picture1.ScaleWidth / 7 * (i - 0.5)
aryPoint((i - 1) * 3 + 1).y = Picture1.ScaleHeight - colP(i)
aryPoint((i - 1) * 3 + 2).x = Picture1.ScaleWidth / 7 * (i - 0.5)
aryPoint((i - 1) * 3 + 2).y = Picture1.ScaleHeight - colP(i + 1)
'数据点
aryPoint((i - 1) * 3 + 3).x = Picture1.ScaleWidth / 7 * i
aryPoint((i - 1) * 3 + 3).y = Picture1.ScaleHeight - colP(i + 1)
Next
'画线
PolyBezier Picture1.hdc, aryPoint(0), UBound(aryPoint) + 1
End Sub
Private Sub Form_Load()
Me.ScaleMode = 3
Me.Picture1.ScaleMode = 3
End Sub