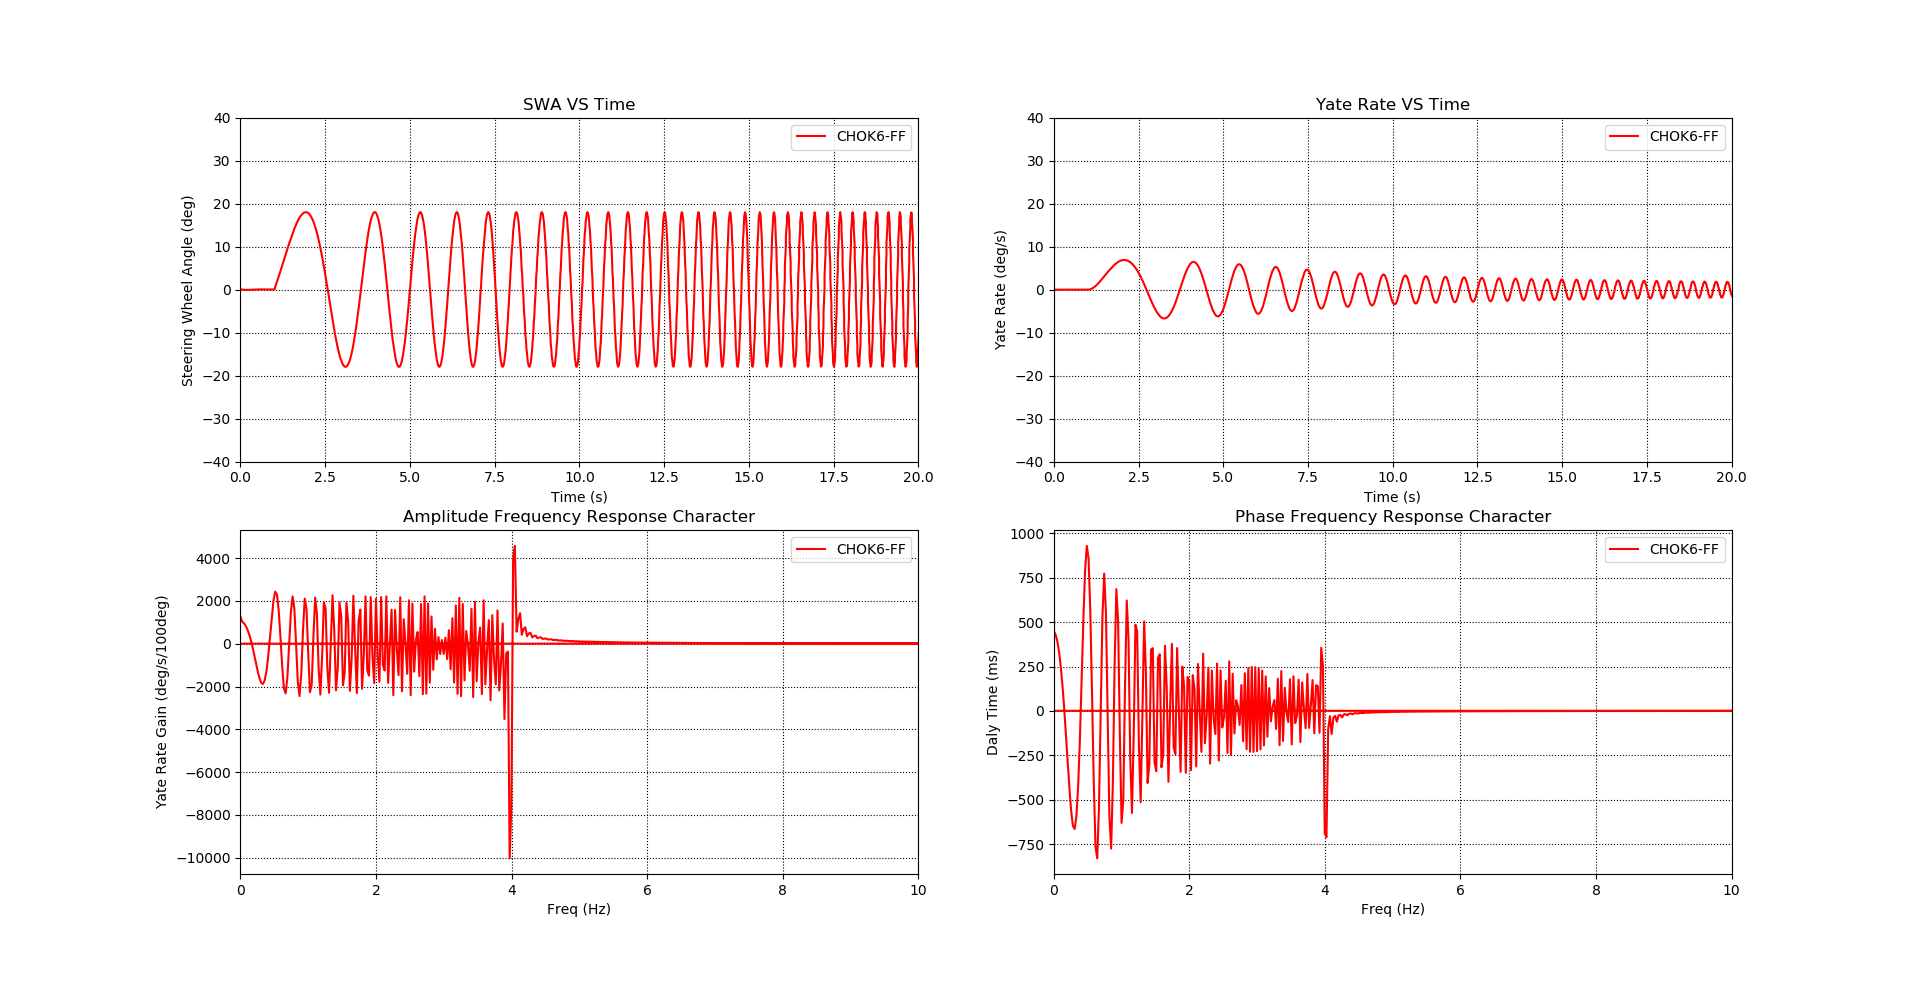
如上图,请教为什么FFT后的频率曲线,总有零点附近处的一条直线,需要怎么处理。代码如下:
CSV文件数据读入\
import time
import pandas as pd
import numpy as np
import matplotlib.pyplot as plt
from scipy import optimize
from scipy.misc import derivative
import scipy.fftpack as fftpack
#导入结果数据
data = pd.read_csv('condition_sensors.txt',sep="\t",header=0,dtype="float16")
rowNum=data.shape[0] #不包括表头
colNum=data.columns.size
print('行数:',rowNum)
print('列数:',colNum)
# 数据指标定义
t=data['TIME']
f_s=100 #采样频率
Lateral_Acc=data['lateral_acceleration']/9810
SWA=data['steering_wheel_angle']
Yate_rate=data['yaw_rate']
Roll_angle=data['roll_angle']
# 时域数据曲线
fig = plt.figure("Sweep Sine : Yate Rate VS SWA ",figsize=(20,20))
ax1 = fig.add_subplot(2,2,1)
#设置ax1
ax1.plot(t,SWA,'r-',label='CHOK6-FF')
ax1.set_title('SWA VS Time')
ax1.set_xlim(0,20)
ax1.set_ylim(-40,40)
ax1.set_xlabel('Time (s)')
ax1.set_ylabel('Steering Wheel Angle (deg)')
ax1.legend(loc='best')
ax1.grid(color='black',ls=":")
#设置ax2
ax2 = fig.add_subplot(2,2,2)
ax2.plot(t,Yate_rate,'r-',label='CHOK6-FF')
ax2.set_title('Yate Rate VS Time')
ax2.set_xlim(0,20)
ax2.set_ylim(-40,40)
ax2.set_xlabel('Time (s)')
ax2.set_ylabel('Yate Rate (deg/s)')
ax2.legend(loc='best')
ax2.grid(color='black',ls=":")
# 傅立叶变换
SWA_FFT= fftpack.fft(SWA)
Yate_rate_FFT = fftpack.fft(Yate_rate)
freqs = fftpack.fftfreq(len(SWA))*f_s
# 作频率特性曲线
ax3 = fig.add_subplot(2,2,3)
ax3.plot(freqs,SWA_FFT,'r-',label='CHOK6-FF')
ax3.set_title('Amplitude Frequency Response Character')
ax3.set_xlim(0,10)
#ax3.set_ylim(-40,40)
ax3.set_xlabel('Freq (Hz)')
ax3.set_ylabel('Yate Rate Gain (deg/s/100deg)')
ax3.legend(loc='best')
ax3.grid(color='black',ls=":")
ax4 = fig.add_subplot(2,2,4)
ax4.plot(freqs,Yate_rate_FFT,'r-',label='CHOK6-FF')
ax4.set_title('Phase Frequency Response Character')
ax4.set_xlim(0,10)
#ax3.set_ylim(-40,40)
ax4.set_xlabel('Freq (Hz)')
ax4.set_ylabel('Daly Time (ms)')
ax4.legend(loc='best')
ax4.grid(color='black',ls=":")
目的是想做仿真数据的幅频和相频特性曲线,卡在这里,希望高手解答,不胜感激。


 发帖
发帖 与我相关
与我相关 我的任务
我的任务
 分享
分享


