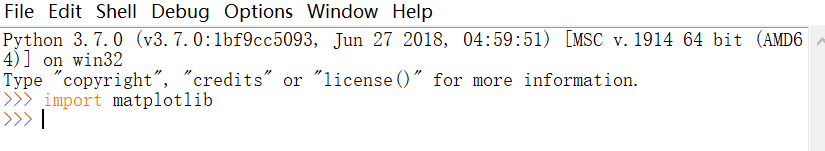
显示导入matplotlib没有问题
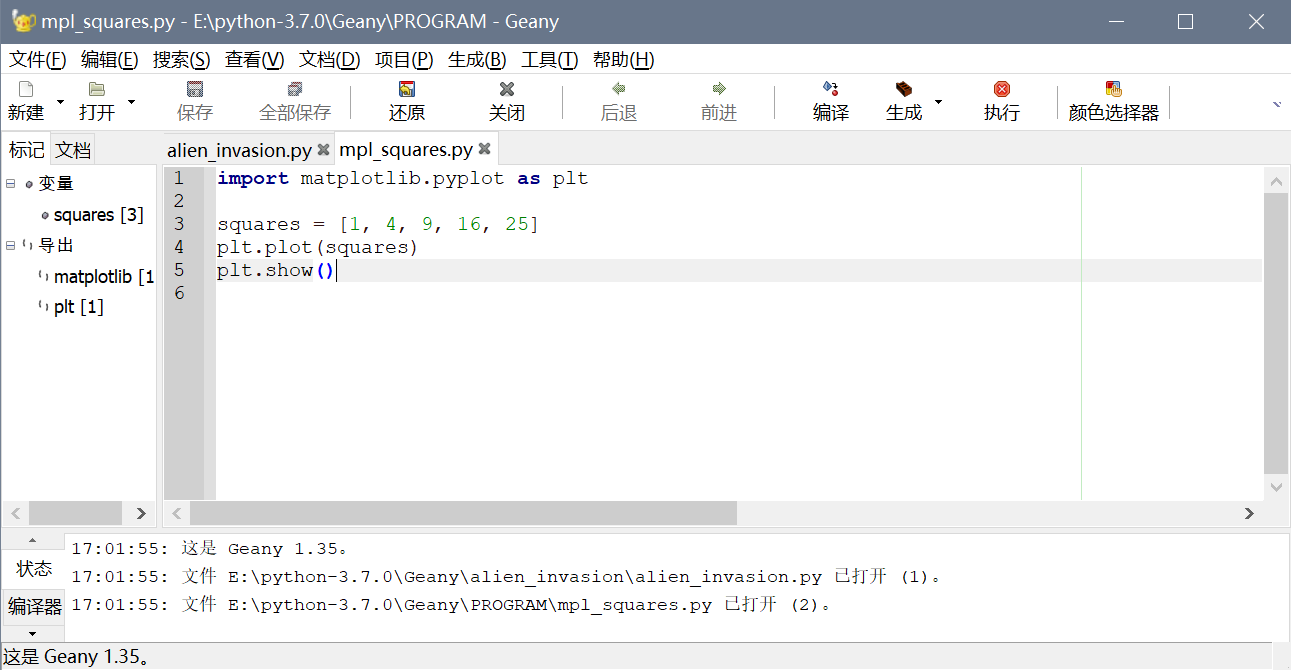
Geany下的代码如图
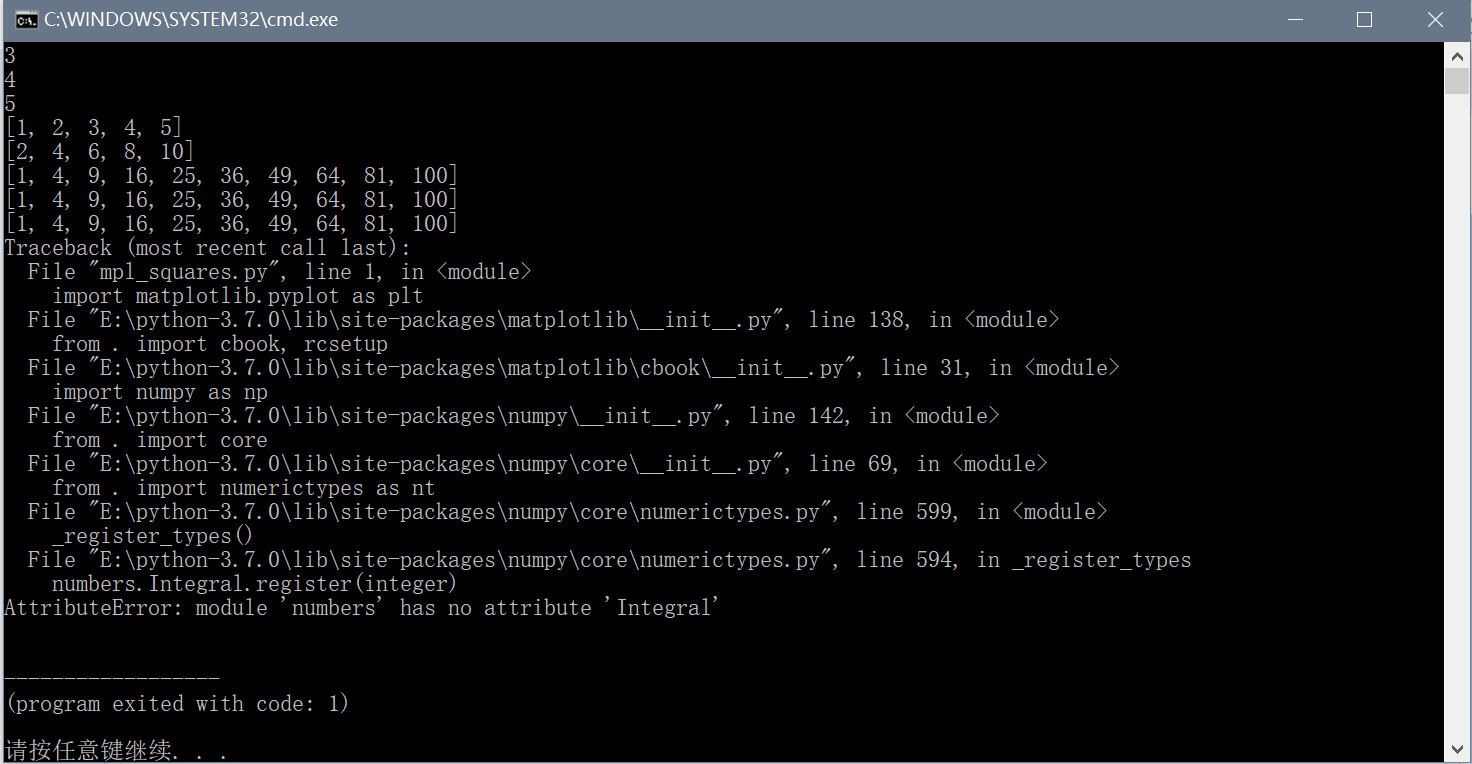
运行结果如图
3
4
5
[1, 2, 3, 4, 5]
[2, 4, 6, 8, 10]
[1, 4, 9, 16, 25, 36, 49, 64, 81, 100]
[1, 4, 9, 16, 25, 36, 49, 64, 81, 100]
[1, 4, 9, 16, 25, 36, 49, 64, 81, 100]
Traceback (most recent call last):
File "mpl_squares.py", line 1, in <module>
import matplotlib.pyplot as plt
File "E:\python-3.7.0\lib\site-packages\matplotlib\__init__.py", line 138, in <module>
from . import cbook, rcsetup
File "E:\python-3.7.0\lib\site-packages\matplotlib\cbook\__init__.py", line 31, in <module>
import numpy as np
File "E:\python-3.7.0\lib\site-packages\numpy\__init__.py", line 142, in <module>
from . import core
File "E:\python-3.7.0\lib\site-packages\numpy\core\__init__.py", line 69, in <module>
from . import numerictypes as nt
File "E:\python-3.7.0\lib\site-packages\numpy\core\numerictypes.py", line 599, in <module>
_register_types()
File "E:\python-3.7.0\lib\site-packages\numpy\core\numerictypes.py", line 594, in _register_types
numbers.Integral.register(integer)
AttributeError: module 'numbers' has no attribute 'Integral'
求助!


 发帖
发帖 与我相关
与我相关 我的任务
我的任务
 分享
分享

