

87,904
社区成员
 发帖
发帖 与我相关
与我相关 我的任务
我的任务
 分享
分享

var labelFormatter={
            show:true,
            position:'bottom',
            distance:-30,
            formatter: function(params){
                return '{data|' + params.data + '}\n\n{name|' +  params.seriesName +'}'
            },
            rich:{
                data:{
                    color:'#fff',
                    align:'center',
                    fontSize:18
                },
                name:{
                    color:'#000',
                    align:'center',
                    fontSize:40
                }
            }
        };
var markPointFormatter={
            symbolSize: 1,
            symbolOffset: [0, '50%'],
            label:{
                normal:{
                    position:'top',
                    distance:-30,
                    show:true,
                    formatter:function(params){
                        return '{value|' + params.value + '}';
                    },
                    rich:{
                        value:{
                            color:'#fff',
                            fontSize:20
                        }
                    }
                }
            },
            data: [{type: 'max', name: 'max days: '}]
        };
option = {
    legend: {
        show:true,
        data:['a','b','c','d']
    },
    xAxis: {
        type: 'category'
    },
    yAxis: {
        splitLine: {show: false}
    },
    animationDurationUpdate: 1200,
    series: [{
        name:'a',
        type: 'bar', label:labelFormatter,
        barWidth: 100, barGap:'-100%',
        data: [160],
        markPoint:markPointFormatter
    }, {
        name:'b',barGap:'-100%',
        type: 'bar',label:labelFormatter,
        barWidth: 100, data: ['-', 260],
        markPoint:markPointFormatter
    }, {
        name:'c',barGap:'-100%',
        type: 'bar',label:labelFormatter,
        barWidth: 100, data: ['-', '-', 90],
        markPoint:markPointFormatter
    }, {
        name:'d',barGap:'-100%',
        type: 'bar',label:labelFormatter,
        barWidth: 100, data: ['-', '-','-',160],
        markPoint:markPointFormatter
    }]
};

var labelFormatter={

            show:true,

            position:'bottom',

            distance:-30,

            formatter: function(params){

                console.log(params)

                return '{data|' + params.data + '}\n\n{name|' +  params.seriesName +'}'

            },

            rich:{

                data:{

                    color:'#fff',

                    align:'center',

                    fontSize:18

                },

                name:{

                    color:'#000',

                    align:'center',

                    fontSize:40

                }

            }

        };

option = {

    legend: {

        show:true,

        data:['a','b','c','d']

    },

    xAxis: {

        type: 'category'

    },

    yAxis: {

        splitLine: {show: false}

    },

    animationDurationUpdate: 1200,

    series: [{

        name:'a',

        type: 'bar', label:labelFormatter,

        barWidth: 100, barGap:'-100%',

        data: [160]

    }, {

        name:'b',

        type: 'bar',label:labelFormatter,

        barWidth: 100, data: ['-', 260]

    }, {

        name:'c',

        type: 'bar',label:labelFormatter,

        barWidth: 100, data: ['-', '-', 90]

    }, {

        name:'d',

        type: 'bar',label:labelFormatter,

        barWidth: 100, data: ['-', '-','-',160]

    }]

};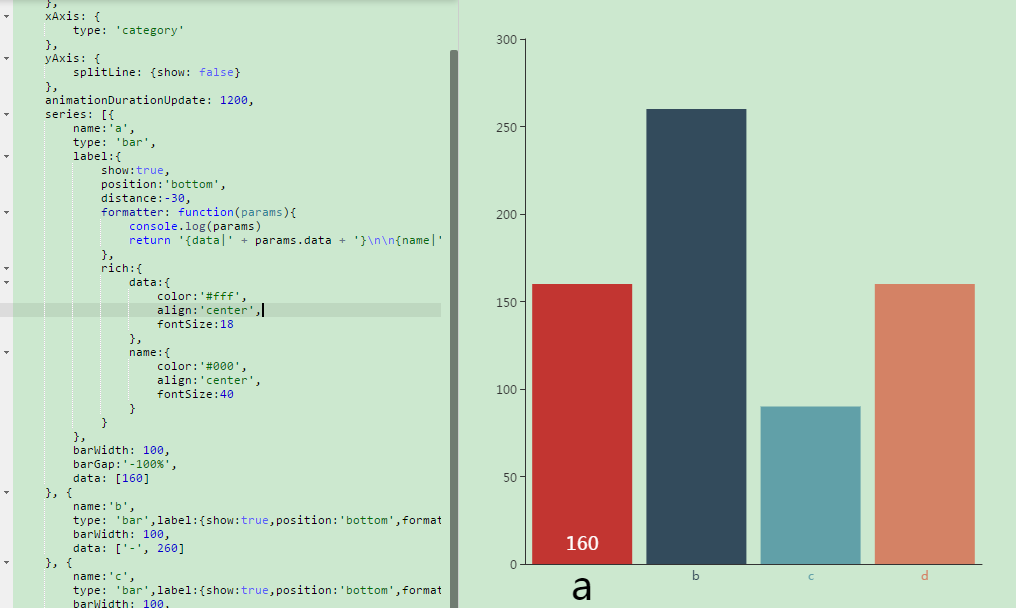
option = {

    legend: {

        show:true,

        data:['a','b','c','d']

    },

    xAxis: {

        type: 'category'

    },

    yAxis: {

        splitLine: {show: false}

    },

    animationDurationUpdate: 1200,

    series: [{

        name:'a',

        type: 'bar',

        label:{

            show:true,

            position:'bottom',

            distance:-30,

            formatter: function(params){

                console.log(params)

                return '{data|' + params.data + '}\n\n{name|' +  params.seriesName +'}'

            },

            rich:{

                data:{

                    color:'#fff',

                    align:'center',

                    fontSize:18

                },

                name:{

                    color:'#000',

                    align:'center',

                    fontSize:40

                }

            }

        },

        barWidth: 100,

        barGap:'-100%',

        data: [160]

    }, {

        name:'b',

        type: 'bar',label:{show:true,position:'bottom',formatter: '{a}'},

        barWidth: 100,

        data: ['-', 260]

    }, {

        name:'c',

        type: 'bar',label:{show:true,position:'bottom',formatter: '{a}'},

        barWidth: 100,

        data: ['-', '-', 90]

    }, {

        name:'d',

        type: 'bar',label:{show:true,position:'bottom',formatter: '{a}'},

        barWidth: 100,

        data: ['-', '-','-',160]

    }]

};option = {
legend: {
show:true,
data:['a','b','c','d']
},
xAxis: {
type: 'category'
},
yAxis: {
splitLine: {show: false}
},
animationDurationUpdate: 1200,
series: [{
name:'a',
type: 'bar',
label:{
show:true,
position:'bottom',
formatter: '{a}'
},
barWidth: 100,
barGap:'-100%',
data: [60]
}, {
name:'b',
type: 'bar',label:{show:true,position:'bottom',formatter: '{a}'},
barWidth: 100,
data: ['-', 260]
}, {
name:'c',
type: 'bar',label:{show:true,position:'bottom',formatter: '{a}'},
barWidth: 100,
data: ['-', '-', 90]
}, {
name:'d',
type: 'bar',label:{show:true,position:'bottom',formatter: '{a}'},
barWidth: 100,
data: ['-', '-','-',160]
}]
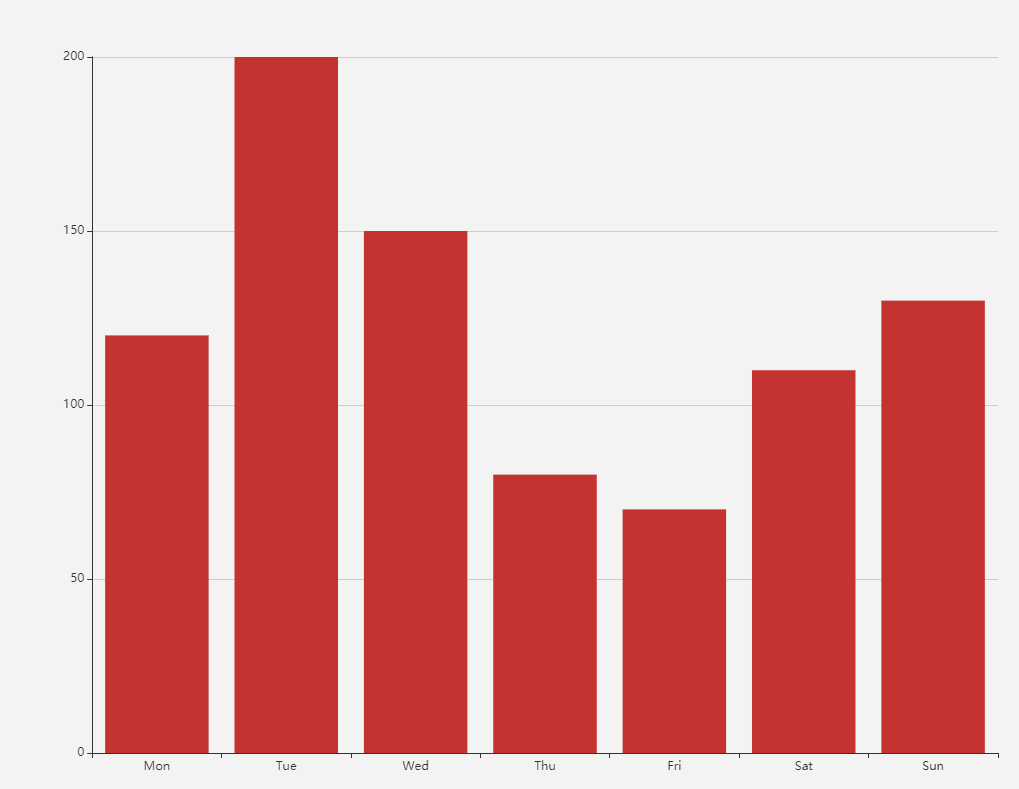
};option = {
legend: {
show:true,
data:['Mon','Tue','Wed','Thu','Fri','Sat','Sun']
},xAxis: {
type: 'category',
data: ['Mon', 'Tue', 'Wed', 'Thu', 'Fri', 'Sat', 'Sun']
},
tooltip:{
show:true
},
yAxis: {
type: 'value'
},
series: [{
stack:'Week',
type:'bar',
name:'Mon',
data:[90]
},{
stack:'Week',
type:'bar',
name:'Tue',
data:[0,200]
},{
stack:'Week',
type:'bar',
name:'Wed',
data:[0,0,120]
},{
stack:'Week',
type:'bar',
name:'Thu',
data:[0,0,0,50]
},{
stack:'Week',
type:'bar',
name:'Fri',
data:[0,0,0,0,88]
},{
stack:'Week',
type:'bar',
name:'Sat',
data:[0,0,0,0,0,99]
},{
stack:'Week',
type:'bar',
name:'Sun',
data:[0,0,0,0,0,0,230]
}]
};

itemStyle : {
              normal : {
                         label : {
                                   show : false
                                  },
                         labelLine : {
                                       show : false
                                      }
                         }
              }


