clc
clear
close all
fs=44100;
Ts=1/fs;%采样周期
L=44100;%采样点数
x=xlsread 20.1.xls;
STA=0; %采样起始位置
t=(0:L-1)*Ts;%时间序列
figure
plot(t,x);
title('20Hz');
x1=x';
y= mckd(x1,
100,30,
100,
8,1);
figure
plot(y);
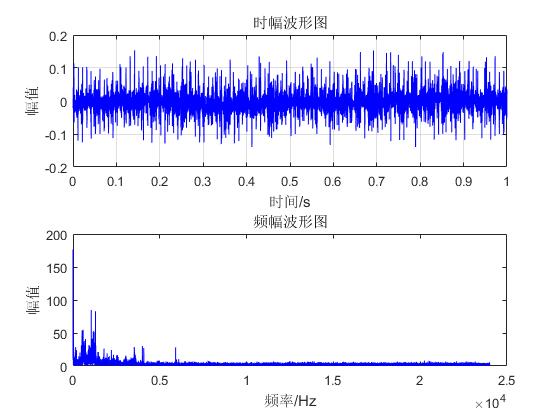
已知采样频率44100,采样点数44100,原数据的时频图如图所示,对数据进行MCKD处理,这里的步长、周期、移位数怎么确定?


 发帖
发帖 与我相关
与我相关 我的任务
我的任务
 分享
分享