我用echarts做了一个折线图demo,想获取缩放时的开始结点和结束结点的值,查看文档没有找到相应办法,百度到了一个解决方案
myChart.on('dataZoom', function (params) {
var batch = params.batch[0];
var opt = myChart.getOption();
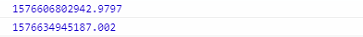
console.log(batch.startValue);
console.log(batch.endValue);
var startTime = opt.xAxis[0].data[batch.startValue];
var endTime = opt.xAxis[0].data[batch.endValue];
});
因为我的x轴type为time,这样取到batch.startValue 和 batch.endValue 不知道是什么值
不明白为什么应该取到数组索引却取到了这样的值,下图为x轴的数组data
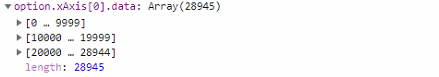
试了一下将type换位category,batch.startValue 和 batch.endValue取到的是data数组的索引,可以通过opt.xAxis[0].data[batch.startValue];取得相应值,但是折线图就显示不出来了,不太懂为什么


 发帖
发帖 与我相关
与我相关 我的任务
我的任务
 分享
分享

