


37,743
社区成员
 发帖
发帖 与我相关
与我相关 我的任务
我的任务
 分享
分享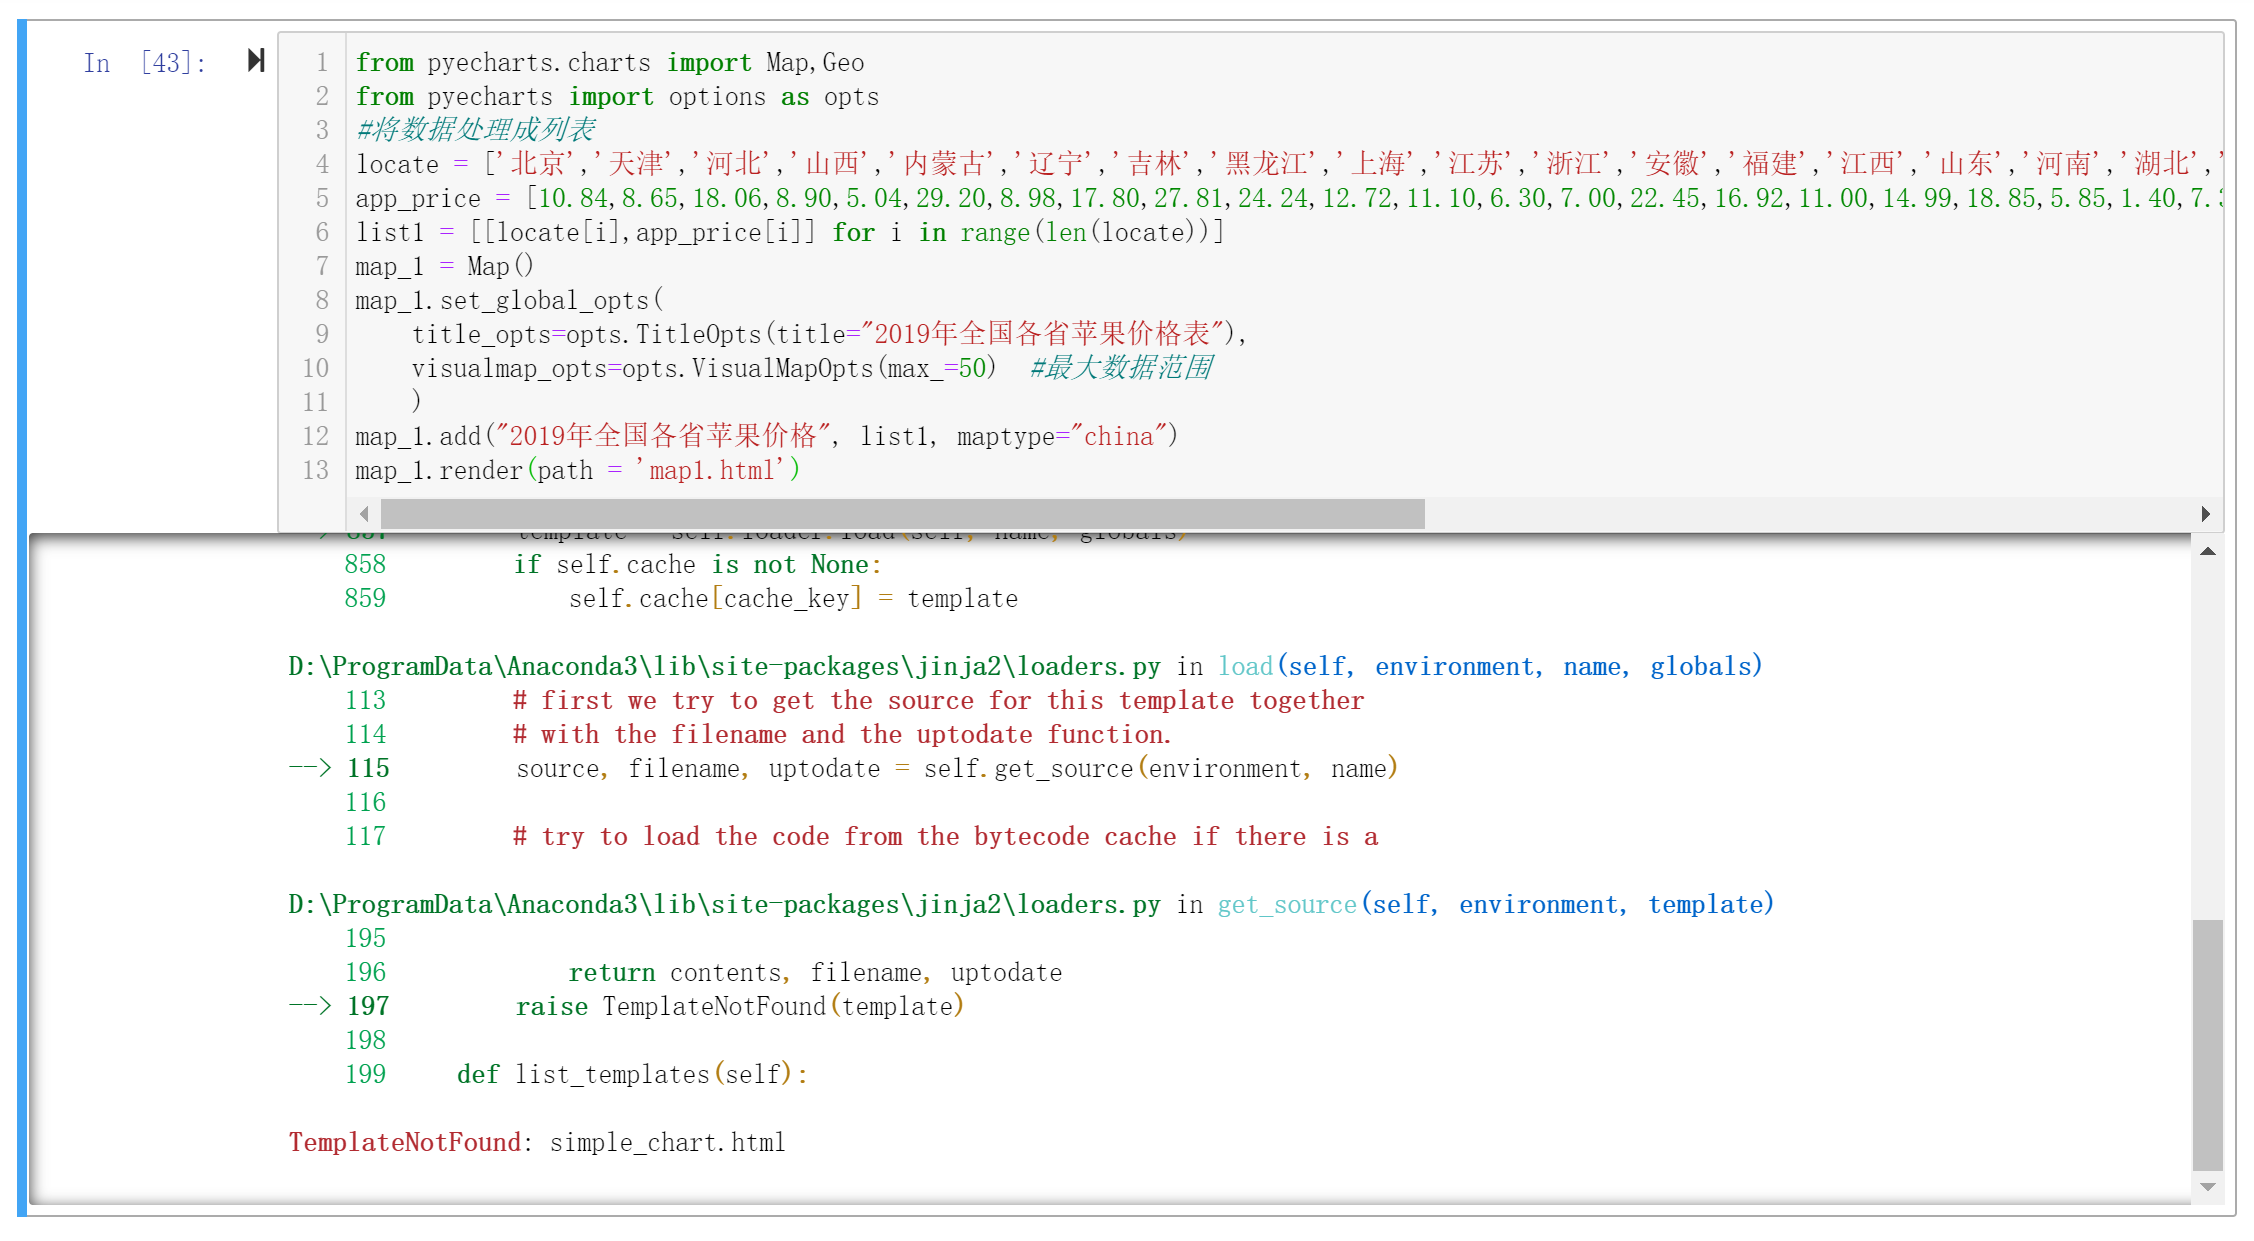
from pyecharts.charts import Map,Geo

from pyecharts import options as opts

#将数据处理成列表

locate = ['北京','天津','河北','山西','内蒙古','辽宁','吉林','黑龙江','上海','江苏','浙江','安徽','福建','江西','山东','河南','湖北','湖南','广东','广西','海南','重庆','四川','贵州','云南','陕西','甘肃','青海','宁夏','新疆','西藏']

app_price = [10.84,8.65,18.06,8.90,5.04,29.20,8.98,17.80,27.81,24.24,12.72,11.10,6.30,7.00,22.45,16.92,11.00,14.99,18.85,5.85,1.40,7.32,14.61,4.62,6.05,8.07,6.73,15.54,13.00,39.07,25.61,21.3]

list1 = [[locate[i],app_price[i]] for i in range(len(locate))]

map_1 = Map()

map_1.set_global_opts(

    title_opts=opts.TitleOpts(title="2019年全国各省苹果价格表"),

    visualmap_opts=opts.VisualMapOpts(max_=50)  #最大数据范围

    )

map_1.add("2019年全国各省苹果价格", list1, maptype="china")

map_1.render(path = 'map1.html')


