87,996
社区成员
 发帖
发帖 与我相关
与我相关 我的任务
我的任务
 分享
分享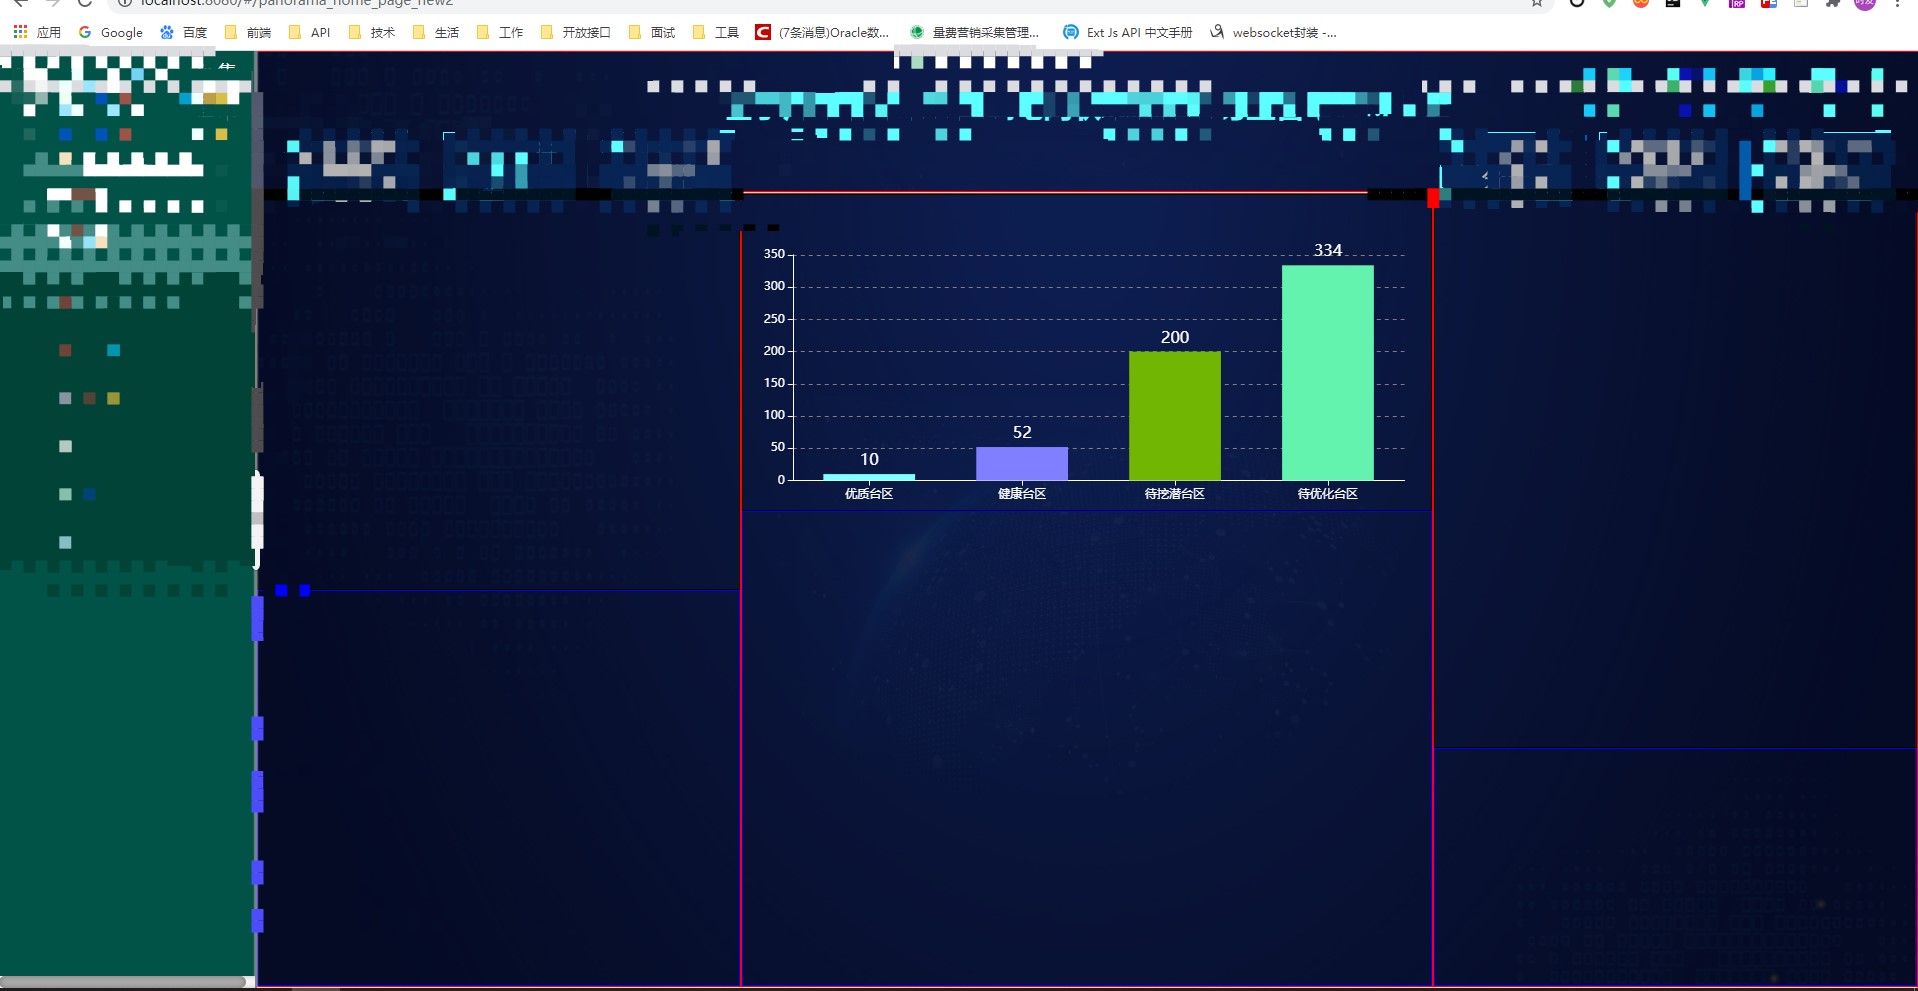
<template>
<div style="height: 100%;width: 100%">
<div id="Histogram" style="height: 100%;width: 100%"></div>
</div>
</template>
<script>
import echarts from 'echarts'
export default {
name: "public",
data() {
return {}
},
mounted(){this.Histogram()},
methods: {
Histogram(){
const option = {
tooltip: {
trigger: 'axis',
axisPointer: { // 坐标轴指示器,坐标轴触发有效
type: 'shadow' // 默认为直线,可选为:'line' | 'shadow'
}
},
grid: {
left: '3%',
right: '4%',
bottom: '3%',
containLabel: true
},
xAxis: [
{
type: 'category',
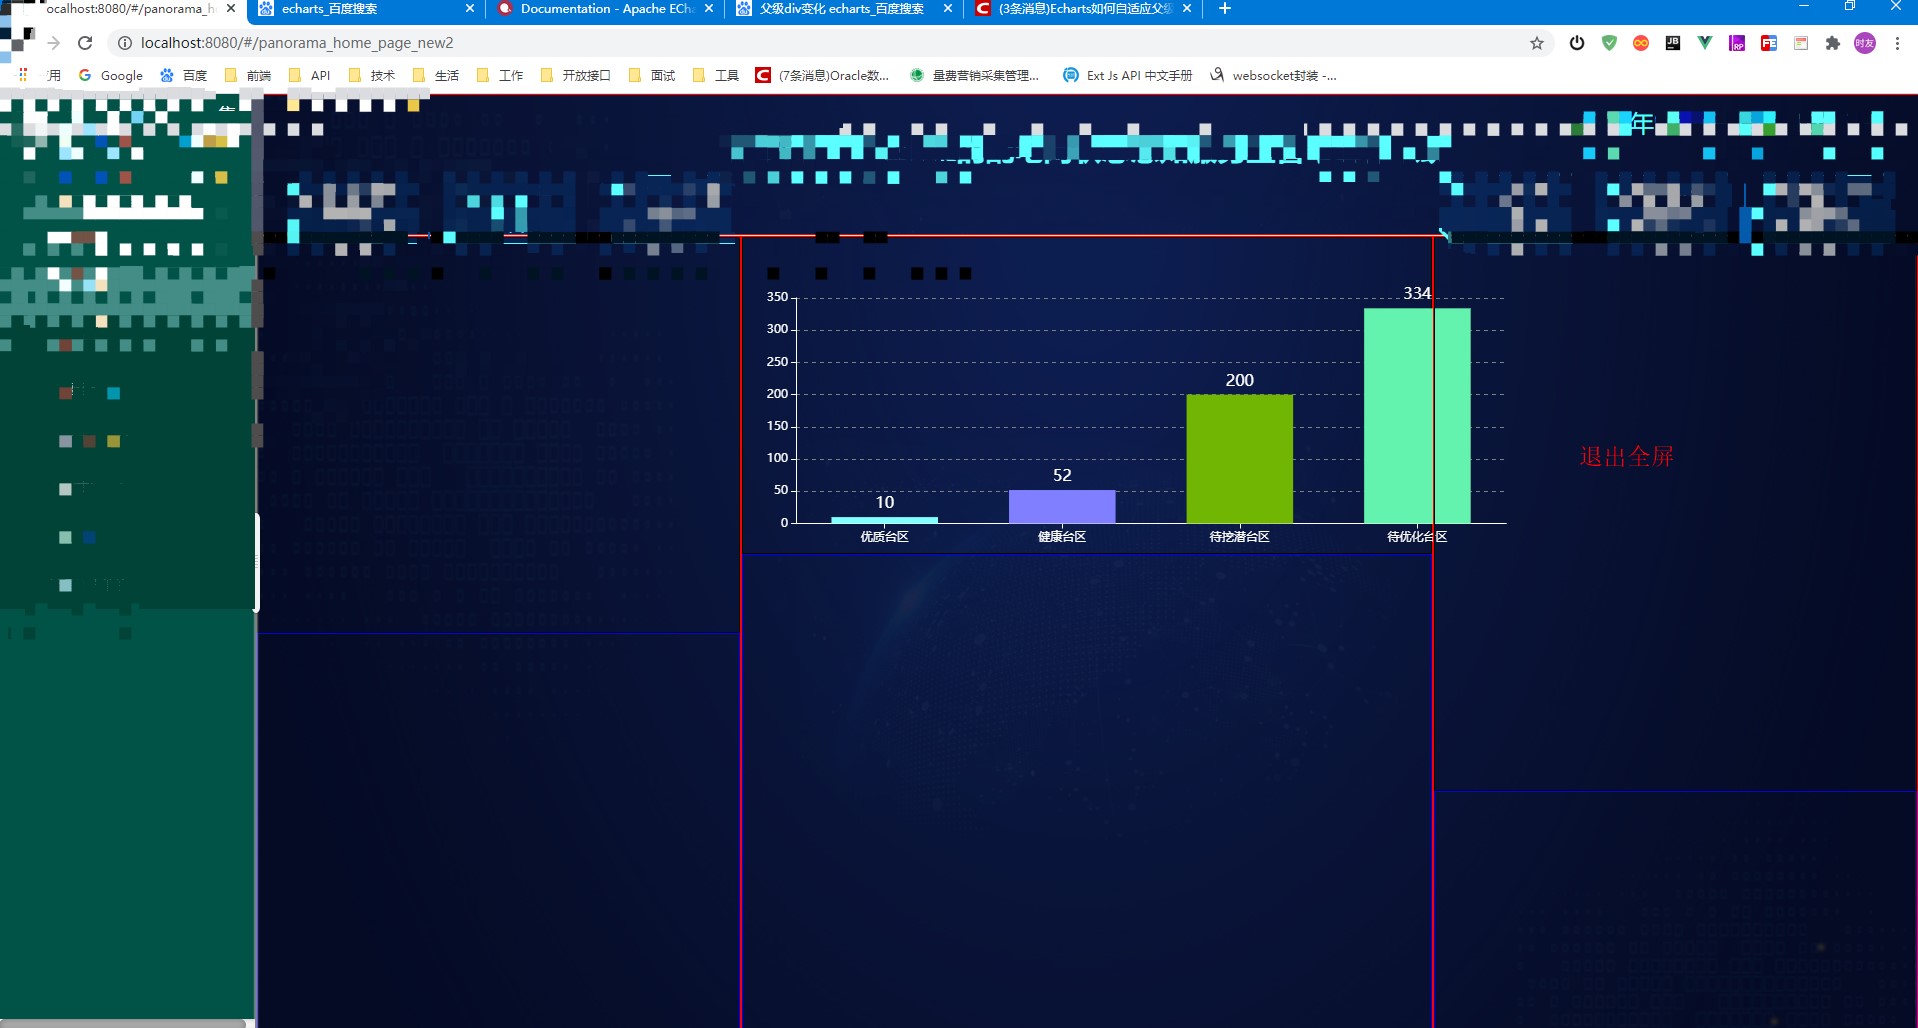
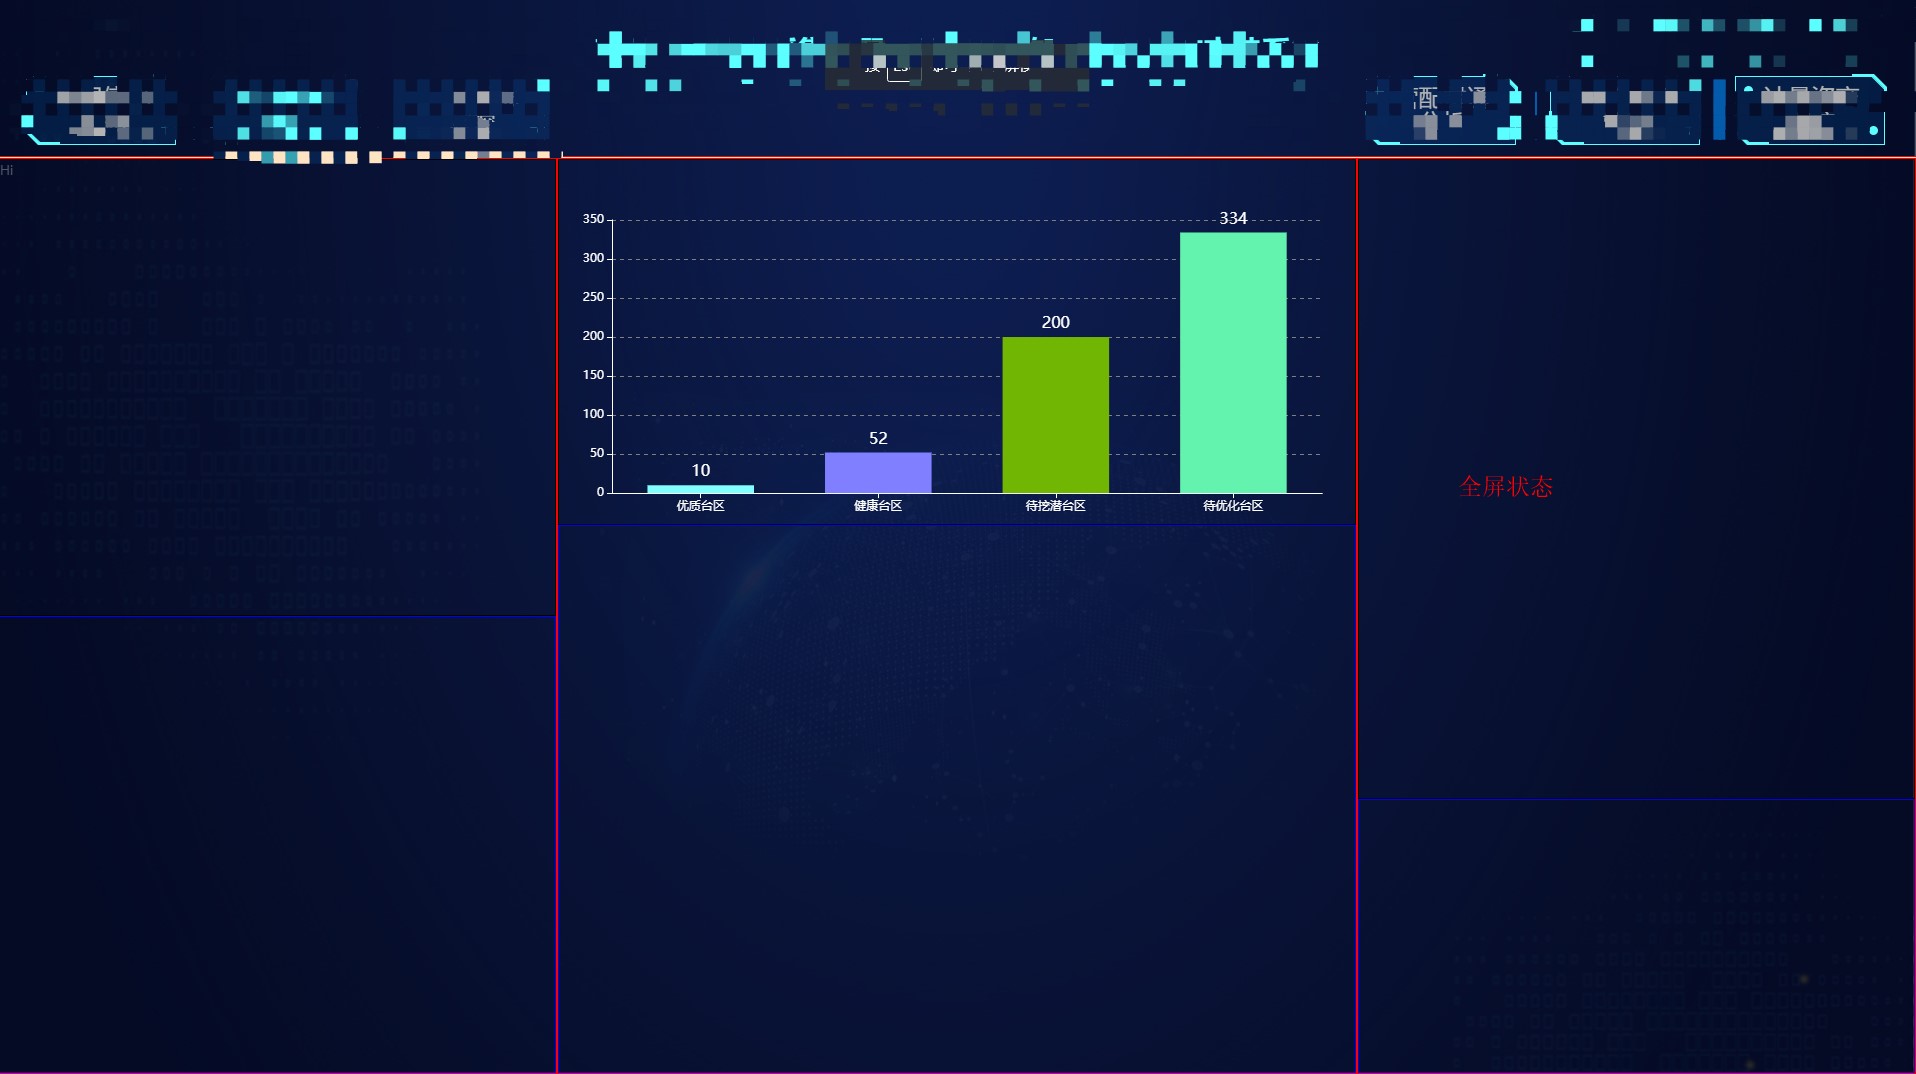
data: ['优质台区', '健康台区', '待挖潜台区', '待优化台区'],
axisTick: {
alignWithLabel: true
},
//设置坐标轴字体颜色和宽度
axisLine: { //这是x轴文字颜色
lineStyle: {
color: '#fff',
}
}
}
],
yAxis: [
{
type: 'value',
min: 0,
interval: 50,
//splitArea : {show : false}, //去除网格区域
//去除网格线
splitLine:{
lineStyle: {
//灰色
color:'gray',
type: 'dashed'
}
},
//设置坐标轴字体颜色和宽度
axisLine: {//这是y轴文字颜色
lineStyle: {
color: '#fff',
}
}
}
],
series: [
{
name: '数量',
type: 'bar',
barWidth: '60%',
data: [10, 52, 200, 334],
itemStyle: {
normal: {
color: function(params) {
var colorList = [
'#80FFFF','#8080FF','#70B603','#63F3AE'
];
return colorList[params.dataIndex]
},
label: {
show: true, //开启显示
position: 'top', //在上方显示
textStyle: { //数值样式
color: 'white',
fontSize: 16
}
}
}
},
}
]
};
const loadChart = echarts.init(document.getElementById('Histogram'));
loadChart.setOption(option);
window.onresize = loadChart.resize;
/* $(window).resize(function() {//这是能够让图表自适应的代码
loadChart.resize();
});*/
}
}
}
</script>