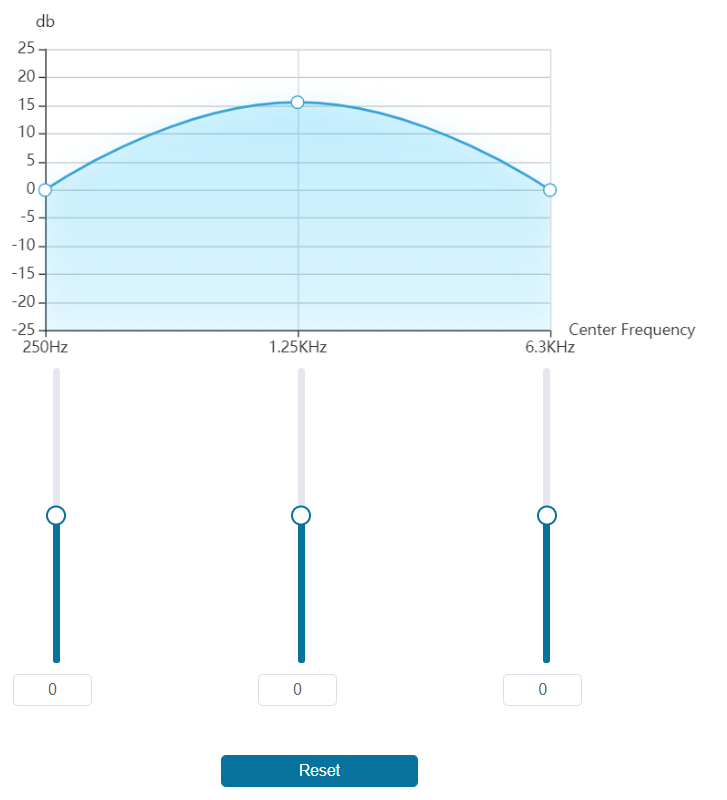
Echarts图表数据联动的问题

2024无限可能! 2021-01-05 02:58:48
目前有一个这样的需求:
拖拽滑块时,图表的节点会跟着上下滑动,上下拖拽图表时,滑块也会跟着动,这个要怎么弄呀?
滑块每次滑动的步长是5,我希望图表每次也是滑动的步长是5,此外,滑动图标时,不能超出,y轴的上下限,那要如何去做范围限定呀?、求求大佬的帮助!!!!项目准备要交了
...全文
21861 8 打赏 收藏 转发到动态 举报
写回复
用AI写文章
8 条回复
切换为时间正序
请发表友善的回复…
发表回复
  • 打赏
  • 举报
回复
我昨天也弄到这里了,就是发现还是有点问题,就是图表拖拽上限的问题,比如我设定的是,最大拖拽的数值是25,然后在顶端那会,图表的节点,有时候拖跩不下来,而且还有一个问题就是,当我鼠标不在表格区域内时,拖拽就无效了。
hundundao 2021-01-11
  • 打赏
  • 举报
回复

<template>
  <div class="echart">
    <div id="chart" style="width: 600px;height: 400px"></div>
    <div v-for="(item,i) in data" :key="i">
      <input type="number" v-model.number="item[1]" :step="step"></input>
      <input type="range" v-model.number="item[1]" :step="step" :min="0" :max="25"></input>
    </div>
  </div>
</template>

<script>
  let echarts = require('echarts');
  export default {
    name: "echart",
    data() {
      return {
        myEchart: null,
        xLabel : ['250Hz', '1.25kHz', '6.3kHz'],
        data:[['250Hz', 0], ['1.25kHz', 15], ['6.3kHz', 0]],
        height: 0,
        symbolSize: 20,
        step: 5,//步长
        stepLength: 0,
      }
    },
    mounted() {
      this.myEchart = echarts.init(document.getElementById('chart'));

      let option = {
        xAxis: {
          type: 'category',
          data: this.xLabel
        },
        yAxis: {
          type: 'value',
          interval:5,
          min:0,
          max:25
        },
        series: [{
          data: this.data,
          type: 'line',
          smooth: true,
          symbolSize: this.symbolSize,
        }]
      };
      this.myEchart.setOption(option);
      let that = this;
      this.myEchart.setOption({
        graphic: echarts.util.map(this.data, (item, dataIndex)=>{
          return {
            type: 'circle',
            position: this.myEchart.convertToPixel('grid', item),
            shape: {
              r: this.symbolSize / 2
            },
            invisible: true,
            draggable: true,
            ondrag: echarts.util.curry(function (dataIndex) {
              that.data[dataIndex] = [that.xLabel[dataIndex],that.myEchart.convertFromPixel('grid', this.position)[1]];
              that.myEchart.setOption({
                series: [{
                  data: that.data
                }]
              });
            }, dataIndex),
            onmousedown: echarts.util.curry(this.onmousedown, dataIndex),
            onmouseup: echarts.util.curry(this.onmouseup, dataIndex),
            z: 100
          };
        })
      });
      window.addEventListener('resize', ()=>{
        this.myEchart.setOption({
          graphic: echarts.util.map(this.data, (item, dataIndex)=>{
            return {
              position: this.myEchart.convertToPixel('grid', item)
            };
          })
        });
      });
    },
    methods:{
      onmousedown(dataIndex){
        this.height = this.data[dataIndex][1];
      },
      onmouseup(dataIndex){
        this.stepLength = (this.data[dataIndex][1] - this.height)/this.step;
        if (this.stepLength>0){
          this.stepLength = Math.ceil(this.stepLength)
        } else {
          this.stepLength = Math.floor(this.stepLength)
        }
        this.$set(this.data,dataIndex,[this.xLabel[dataIndex],this.height + this.step*this.stepLength]);
      }
    },
    watch:{
      data:{
        deep:true,
        handler(val){
          console.log(val);
          this.myEchart.setOption({
            series: [{
              data: val
            }]
          });
          this.myEchart.setOption({
            graphic: echarts.util.map(val, (item)=>{
              return {
                position: this.myEchart.convertToPixel('grid', item)
              };
            })
          });
        }
      }
    },
  }
</script>

这是vue的例子= =
  • 打赏
  • 举报
回复
引用 5 楼 hundundao 的回复:

<!DOCTYPE html>
<html lang="ch">
<head>
    <meta charset="utf-8">
    <title>Demo2</title>
</head>
<body>
<div id="main" style="width: 600px;height:400px;"></div>
</body>
<script src="echarts.js"></script>
<script type="text/javascript">
    let symbolSize = 20;
    let step = 5;//步长
    let stepLength = 0;
    let height = 0;
    let data = [['250Hz', 0], ['1.25kHz', 10], ['6.3kHz', 20]];
    let xLabel = ['250Hz', '1.25kHz', '6.3kHz'];
    let myChart = echarts.init(document.getElementById('main'));
    myChart.setOption({
        tooltip: {
            triggerOn: 'none',
            formatter: function (params) {
                return 'Y: ' + params.data[1].toFixed(0);
            }
        },
        xAxis: {
            type: 'category',
            data: ['250Hz', '1.25kHz', '6.3kHz']
        },
        yAxis: {
            min: -0,
            max: 25,
            type: 'value',
            axisLine: {onZero: false}

        },
        series: [
            {
                type: 'line',
                smooth: true,
                symbolSize: symbolSize,
                data: data
            }
        ],
    });
    myChart.setOption({
        graphic: echarts.util.map(data, function (item, dataIndex) {
            return {
                type: 'circle',
                position: myChart.convertToPixel('grid', item),
                shape: {
                    r: symbolSize / 2
                },
                invisible: true,
                draggable: true,
                ondrag: echarts.util.curry(ondrag, dataIndex),
                onmousedown: echarts.util.curry(onmousedown, dataIndex),
                onmouseup: echarts.util.curry(onmouseup, dataIndex),
                z: 100
            };
        })
    });
    window.addEventListener('resize', function () {
        myChart.setOption({
            graphic: echarts.util.map(data, function (item, dataIndex) {
                return {
                    position: myChart.convertToPixel('grid', item)
                };
            })
        });
    });
    function onmousedown(dataIndex) {
        //onmousedown
        height = data[dataIndex][1];
        console.log(height);
    }
    function ondrag(dataIndex) {
        data[dataIndex] = [xLabel[dataIndex],myChart.convertFromPixel('grid', this.position)[1]];
        console.log(data,dataIndex);
        myChart.setOption({
            series: [{
                data: data
            }]
        });
    }
    function onmouseup(dataIndex) {
        //onmouseup

        stepLength = (data[dataIndex][1] - height)/step;
        if (stepLength>0){
            stepLength = Math.ceil(stepLength)
        } else {
            stepLength = Math.floor(stepLength)
        }
        data[dataIndex] = [xLabel[dataIndex],height + step*stepLength];
        console.log('up',data);
        myChart.setOption({
            series: [{
                data: data
            }]
        });
        myChart.setOption({
            graphic: echarts.util.map(data, function (item, dataIndex) {
                return {
                    position: myChart.convertToPixel('grid', item)
                };
            })
        });
    }
</script>
</html>
这个是拖拽折线图拖拽效果,两个例子你合并下应该就能完成你的效果了,下班了=。=不摸鱼了,的确最开始你这个效果用vue会方便的多
真的非常非常感谢大佬。 但是,额,我还是不太懂怎么跟vue-echarts结合使用,裂开
  • 打赏
  • 举报
回复
引用 1 楼 hundundao 的回复:
用Object.defineProperty
可以给个例子吗,或者可以说得详细一些吗,拜托了
hundundao 2021-01-08
  • 打赏
  • 举报
回复

<!DOCTYPE html>
<html lang="ch">
<head>
    <meta charset="utf-8">
    <title>Demo2</title>
</head>
<body>
<div id="main" style="width: 600px;height:400px;"></div>
</body>
<script src="echarts.js"></script>
<script type="text/javascript">
    let symbolSize = 20;
    let step = 5;//步长
    let stepLength = 0;
    let height = 0;
    let data = [['250Hz', 0], ['1.25kHz', 10], ['6.3kHz', 20]];
    let xLabel = ['250Hz', '1.25kHz', '6.3kHz'];
    let myChart = echarts.init(document.getElementById('main'));
    myChart.setOption({
        tooltip: {
            triggerOn: 'none',
            formatter: function (params) {
                return 'Y: ' + params.data[1].toFixed(0);
            }
        },
        xAxis: {
            type: 'category',
            data: ['250Hz', '1.25kHz', '6.3kHz']
        },
        yAxis: {
            min: -0,
            max: 25,
            type: 'value',
            axisLine: {onZero: false}

        },
        series: [
            {
                type: 'line',
                smooth: true,
                symbolSize: symbolSize,
                data: data
            }
        ],
    });
    myChart.setOption({
        graphic: echarts.util.map(data, function (item, dataIndex) {
            return {
                type: 'circle',
                position: myChart.convertToPixel('grid', item),
                shape: {
                    r: symbolSize / 2
                },
                invisible: true,
                draggable: true,
                ondrag: echarts.util.curry(ondrag, dataIndex),
                onmousedown: echarts.util.curry(onmousedown, dataIndex),
                onmouseup: echarts.util.curry(onmouseup, dataIndex),
                z: 100
            };
        })
    });
    window.addEventListener('resize', function () {
        myChart.setOption({
            graphic: echarts.util.map(data, function (item, dataIndex) {
                return {
                    position: myChart.convertToPixel('grid', item)
                };
            })
        });
    });
    function onmousedown(dataIndex) {
        //onmousedown
        height = data[dataIndex][1];
        console.log(height);
    }
    function ondrag(dataIndex) {
        data[dataIndex] = [xLabel[dataIndex],myChart.convertFromPixel('grid', this.position)[1]];
        console.log(data,dataIndex);
        myChart.setOption({
            series: [{
                data: data
            }]
        });
    }
    function onmouseup(dataIndex) {
        //onmouseup

        stepLength = (data[dataIndex][1] - height)/step;
        if (stepLength>0){
            stepLength = Math.ceil(stepLength)
        } else {
            stepLength = Math.floor(stepLength)
        }
        data[dataIndex] = [xLabel[dataIndex],height + step*stepLength];
        console.log('up',data);
        myChart.setOption({
            series: [{
                data: data
            }]
        });
        myChart.setOption({
            graphic: echarts.util.map(data, function (item, dataIndex) {
                return {
                    position: myChart.convertToPixel('grid', item)
                };
            })
        });
    }
</script>
</html>
这个是拖拽折线图拖拽效果,两个例子你合并下应该就能完成你的效果了,下班了=。=不摸鱼了,的确最开始你这个效果用vue会方便的多
  • 打赏
  • 举报
回复
引用 3 楼 hundundao 的回复:

<!DOCTYPE html>
<html lang="ch">
<head>
    <meta charset="UTF-8">
    <title>Demo1</title>
</head>
<body>

</body>
<script src="echarts.js"></script>
<script>
    let myChart = document.createElement('div');
    myChart.style = "width: 600px;height:400px";
    document.body.appendChild(myChart);
    let chart = echarts.init(myChart);
    let data = {
        "0":5,
        "1":15,
        "2":0
    };
    let number = [];
    let range = [];
    let option = {
        xAxis: {
            type: 'category',
            data: ['250Hz', '1.25kHz', '6.3kHz']
        },
        yAxis: {
            type: 'value',
            interval:5,
            min:0,
            max:25
        },
        series: [{
            data: [data["0"],data["1"],data["2"]],
            type: 'line',
            smooth: true
        }]
    };
    chart.setOption(option);
    for (let i = 0; i < 3; i++) {
        number[i] = document.createElement('input');
        number[i].step = "5";
        number[i].type = "number";
        number[i].value = data[i+""];
        number[i].onchange = function(){
            data[i+""] = number[i].value;
        };

        range[i] = document.createElement('input');
        range[i].step = "5";
        range[i].min = "0";
        range[i].max = "25";
        range[i].type = "range";
        range[i].value = data[i+""];
        range[i].onchange = function(){
            data[i+""] = range[i].value;
        };

        document.body.appendChild(number[i]);
        document.body.appendChild(range[i]);

    }

    Object.keys(data).forEach(key => {
        definedAttribute(data, key, data[key])
    });
    function definedAttribute(obj, key, val){
        Object.defineProperty(obj, key, {
            configurable: false,
            get(){
                return val
            },
            set(newVal){
                if(val !== newVal){
                    val = newVal;
                    let option = {
                        series: [{
                            data: [data["0"],data["1"],data["2"]],
                        }]
                    };
                    chart.setOption(option);
                    for (let i = 0; i <3; i++) {
                        number[i].value = data[i+""];
                        range[i].value = data[i+""];
                    }
                }
            }
        })
    }
</script>
</html>
试了一下你的例子,发现可以通过滑块控制图表节点的滑动了,首先,非常感谢大佬! 我目前改用了vue-echarts也实现了通过滑块去控制图表节点的滑动。 但是如何通过拖动图表的节点去控制滑块的移动,还没实现,不知大佬是否还有招数,在此谢谢了。 对啦,我的项目是用vue框架来做的,所以我用了vue-echarts去实现我想要的功能。
hundundao 2021-01-08
  • 打赏
  • 举报
回复

<!DOCTYPE html>
<html lang="ch">
<head>
    <meta charset="UTF-8">
    <title>Demo1</title>
</head>
<body>

</body>
<script src="echarts.js"></script>
<script>
    let myChart = document.createElement('div');
    myChart.style = "width: 600px;height:400px";
    document.body.appendChild(myChart);
    let chart = echarts.init(myChart);
    let data = {
        "0":5,
        "1":15,
        "2":0
    };
    let number = [];
    let range = [];
    let option = {
        xAxis: {
            type: 'category',
            data: ['250Hz', '1.25kHz', '6.3kHz']
        },
        yAxis: {
            type: 'value',
            interval:5,
            min:0,
            max:25
        },
        series: [{
            data: [data["0"],data["1"],data["2"]],
            type: 'line',
            smooth: true
        }]
    };
    chart.setOption(option);
    for (let i = 0; i < 3; i++) {
        number[i] = document.createElement('input');
        number[i].step = "5";
        number[i].type = "number";
        number[i].value = data[i+""];
        number[i].onchange = function(){
            data[i+""] = number[i].value;
        };

        range[i] = document.createElement('input');
        range[i].step = "5";
        range[i].min = "0";
        range[i].max = "25";
        range[i].type = "range";
        range[i].value = data[i+""];
        range[i].onchange = function(){
            data[i+""] = range[i].value;
        };

        document.body.appendChild(number[i]);
        document.body.appendChild(range[i]);

    }

    Object.keys(data).forEach(key => {
        definedAttribute(data, key, data[key])
    });
    function definedAttribute(obj, key, val){
        Object.defineProperty(obj, key, {
            configurable: false,
            get(){
                return val
            },
            set(newVal){
                if(val !== newVal){
                    val = newVal;
                    let option = {
                        series: [{
                            data: [data["0"],data["1"],data["2"]],
                        }]
                    };
                    chart.setOption(option);
                    for (let i = 0; i <3; i++) {
                        number[i].value = data[i+""];
                        range[i].value = data[i+""];
                    }
                }
            }
        })
    }
</script>
</html>
hundundao 2021-01-07
  • 打赏
  • 举报
回复
用Object.defineProperty

87,903

社区成员

发帖
与我相关
我的任务
社区描述
Web 开发 JavaScript
社区管理员
  • JavaScript
  • 无·法
加入社区
  • 近7日
  • 近30日
  • 至今
社区公告
暂无公告

试试用AI创作助手写篇文章吧