

61,120
社区成员
 发帖
发帖 与我相关
与我相关 我的任务
我的任务
 分享
分享


 这黑漆麻乌的
<!DOCTYPE html>
<html>
<head>
<meta charset="utf-8">
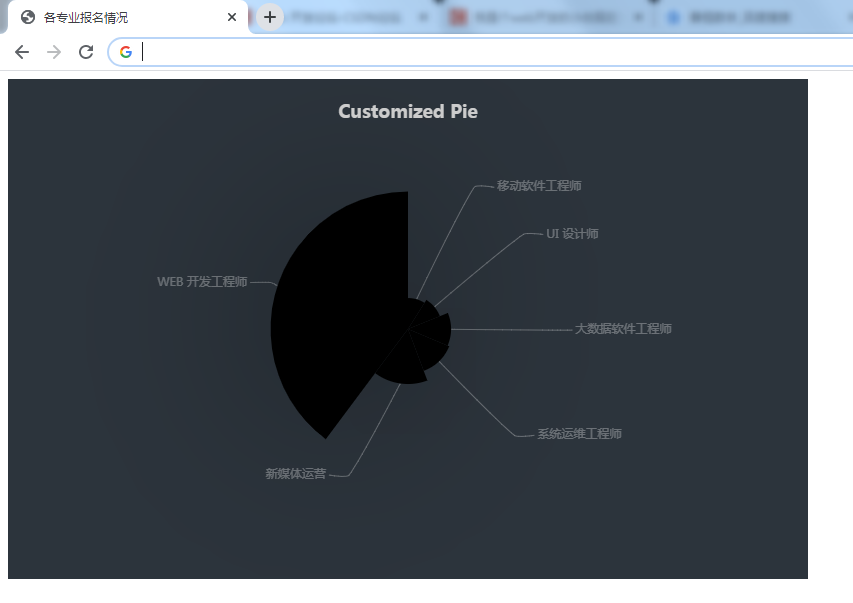
<title>各专业报名情况</title>
<script src="Content/echarts.common.min.js"></script>
</head>
<body>
<div id="divEcharts" style="width:800px;height:500px;"></div>
<script type="text/javascript">
var option = {
backgroundColor: '#2c343c',
title: {
text: 'Customized Pie',
left: 'center',
top: 20,
textStyle: {
color: '#ccc'
}
},
tooltip: {
trigger: 'item'
},
visualMap: {
show: false,
min: 80,
max: 600,
inRange: {
colorLightness: [0, 1]
}
},
series: [
{
name: '各专业报名情况',
type: 'pie',
radius: '55%',
center: ['50%', '50%'],
data: [
{value: 80, name: 'WEB 开发工程师'},
{value: 20, name: 'UI 设计师'},
{value: 25, name: '大数据软件工程师'},
{value: 32, name: '新媒体运营'},
{value: 18, name: '移动软件工程师'},
{value: 26, name: '系统运维工程师'},
].sort(function (a, b) { return a.value - b.value; }),
roseType: 'radius',
label: {
color: 'rgba(255, 255, 255, 0.3)'
},
labelLine: {
lineStyle: {
color: 'rgba(255, 255, 255, 0.3)'
},
smooth: 0.2,
length: 10,
length2: 20
},
itemStyle: {
color: '#c23531',
shadowBlur: 200,
shadowColor: 'rgba(0, 0, 0, 0.5)'
},
animationType: 'scale',
animationEasing: 'elasticOut',
animationDelay: function (idx) {
return Math.random() * 200;
}
}
]
};
var ec = echarts.init(document.getElementById('divEcharts'));
ec.setOption(option);
</script>
</body>


