87,992
社区成员
 发帖
发帖 与我相关
与我相关 我的任务
我的任务
 分享
分享
 】
】
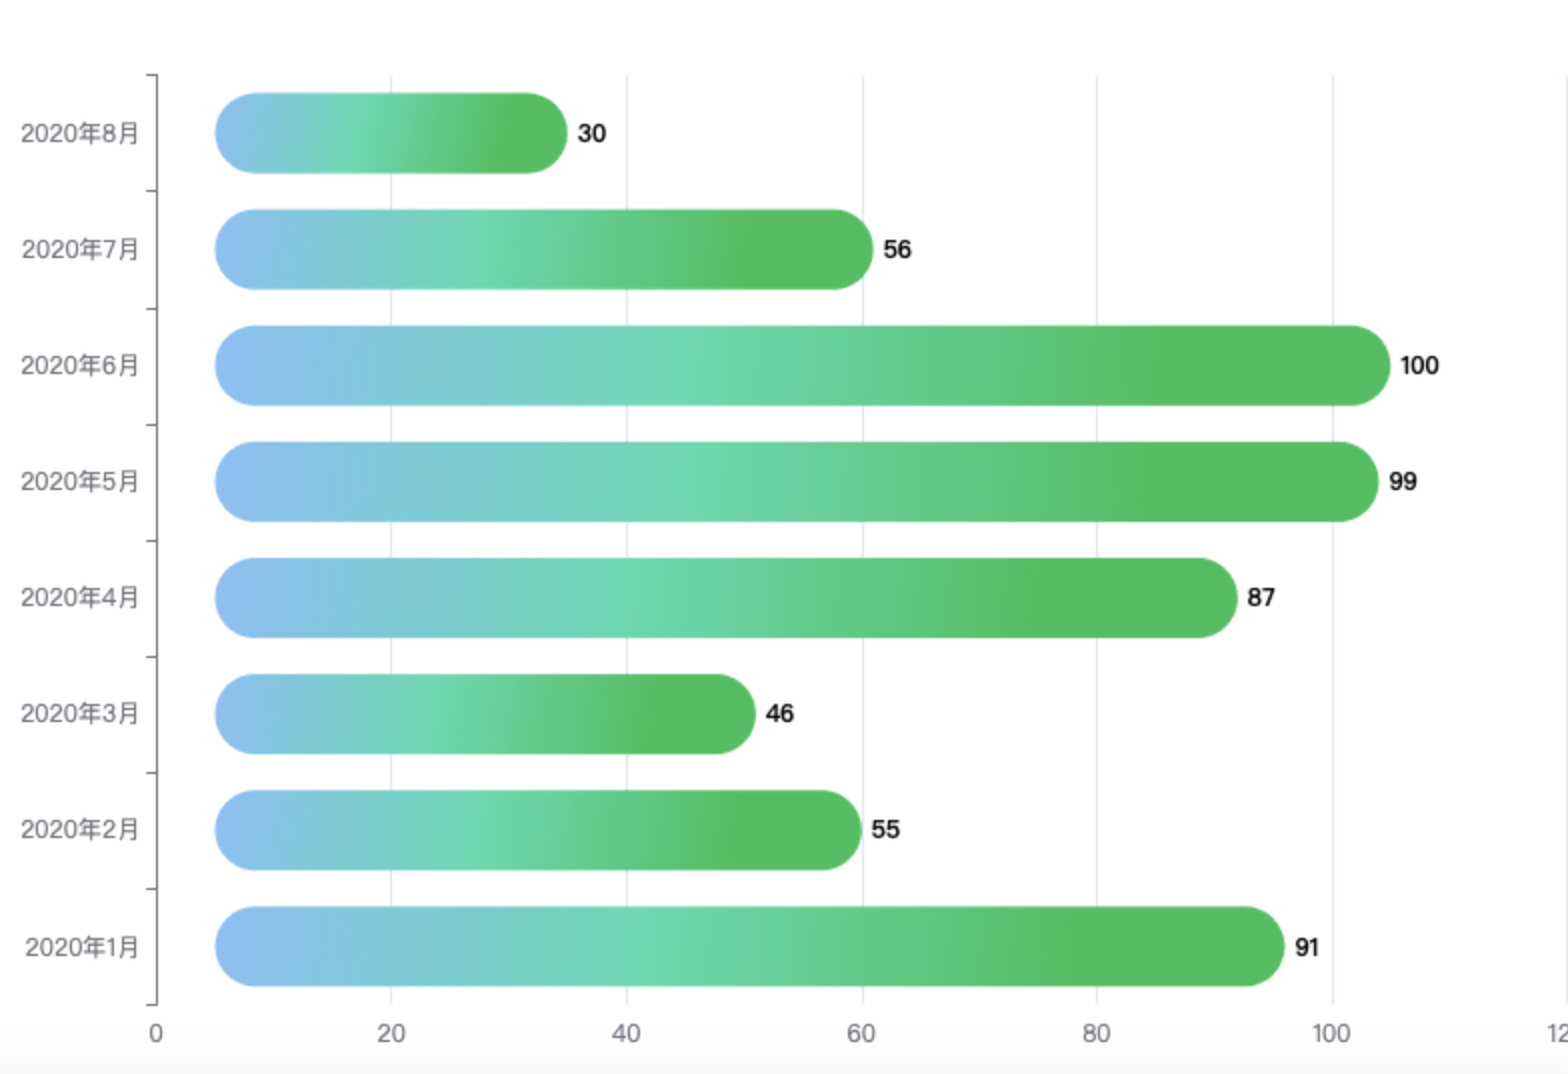
option = {

     title: {

        text: '全市评估报表',

        left: 'center'

    },

    tooltip: {

        trigger: 'axis',

        axisPointer: {

            type: 'shadow'

        }

    },


    grid: {

        top: '15%',

        left: '1%',

        right: '4%',

        bottom: '2%',

        containLabel: true

    },

    xAxis: {

        type: 'value',

        boundaryGap: [0, 0.01],

    },

    yAxis: {

        type: 'category',

        data: ['2020年1月', '2020年2月', '2020年3月', '2020年4月', '2020年5月', '2020年6月', '2020年7月', '2020年8月'],


    },

    series: [

        {


            type: 'bar',

            data: [91, 55, 46, 87, 99,100,56,30],

            itemStyle: {

                 emphasis: {

                            barBorderRadius: 30

                        },

                        normal: {

                            color: new echarts.graphic.LinearGradient(

                                0, 0.3, 0.8, 1,

                    [

                        {offset: 0, color: '#83bff6'},

                        {offset: 0.5, color: '#40daaf'},

                        {offset: 1, color: '#03c158'}

                    ]

                ),

                            //柱形图圆角,初始化效果

                            barBorderRadius:[50, 50, 50, 50],

                            label: {

                                show: true,//是否展示

                                position: 'right',

                                textStyle: {

                                    fontWeight:'bolder',

                                    fontSize : '12',

                                    color: 'black',

                                }

                            }

                        }

            },


        }

    ]

};

在xAxis中的boundaryGap属性,设置为false代表是零刻度开始,设置为true代表离零刻度间隔一段距离
xAxis: {
type: 'category',
boundaryGap: true,
data: ['周一','周二','周三','周四','周五','周六','周日']
},
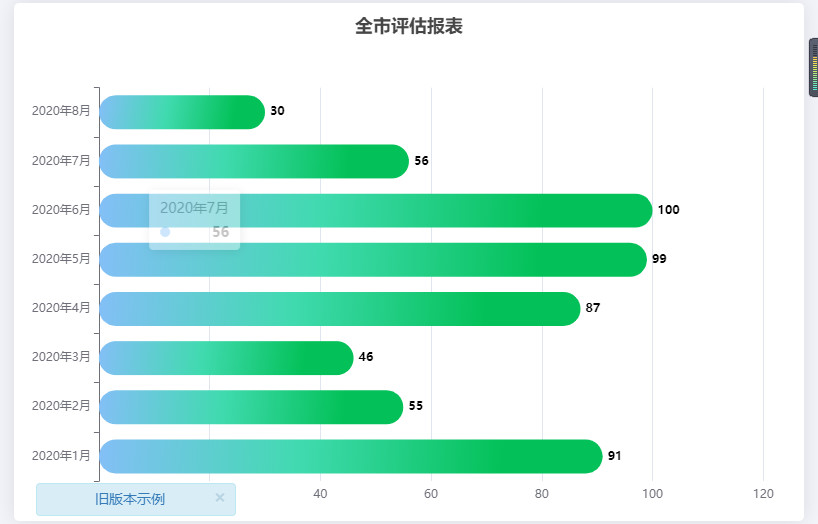
利用双Y轴功能,一个Y左侧偏移,原始Y进行隐藏就可以了

option = {
title: {
text: '全市评估报表',
left: 'center'
},
tooltip: {
trigger: 'axis',
axisPointer: { // 坐标轴指示器,坐标轴触发有效
type: 'shadow' // 默认为直线,可选为:'line' | 'shadow'
},
formatter: function (params) {
var tar = params[1];
return tar.name + '<br/>' + tar.seriesName + ' : ' + tar.value;
}
},
grid: {
top: '15%',
left: '1%',
right: '4%',
bottom: '2%',
containLabel: true
},
xAxis: {
type: 'value',
boundaryGap: [0, 0.01],
},
yAxis: {
type: 'category',
data: ['2020年1月', '2020年2月', '2020年3月', '2020年4月', '2020年5月', '2020年6月', '2020年7月', '2020年8月'],
},
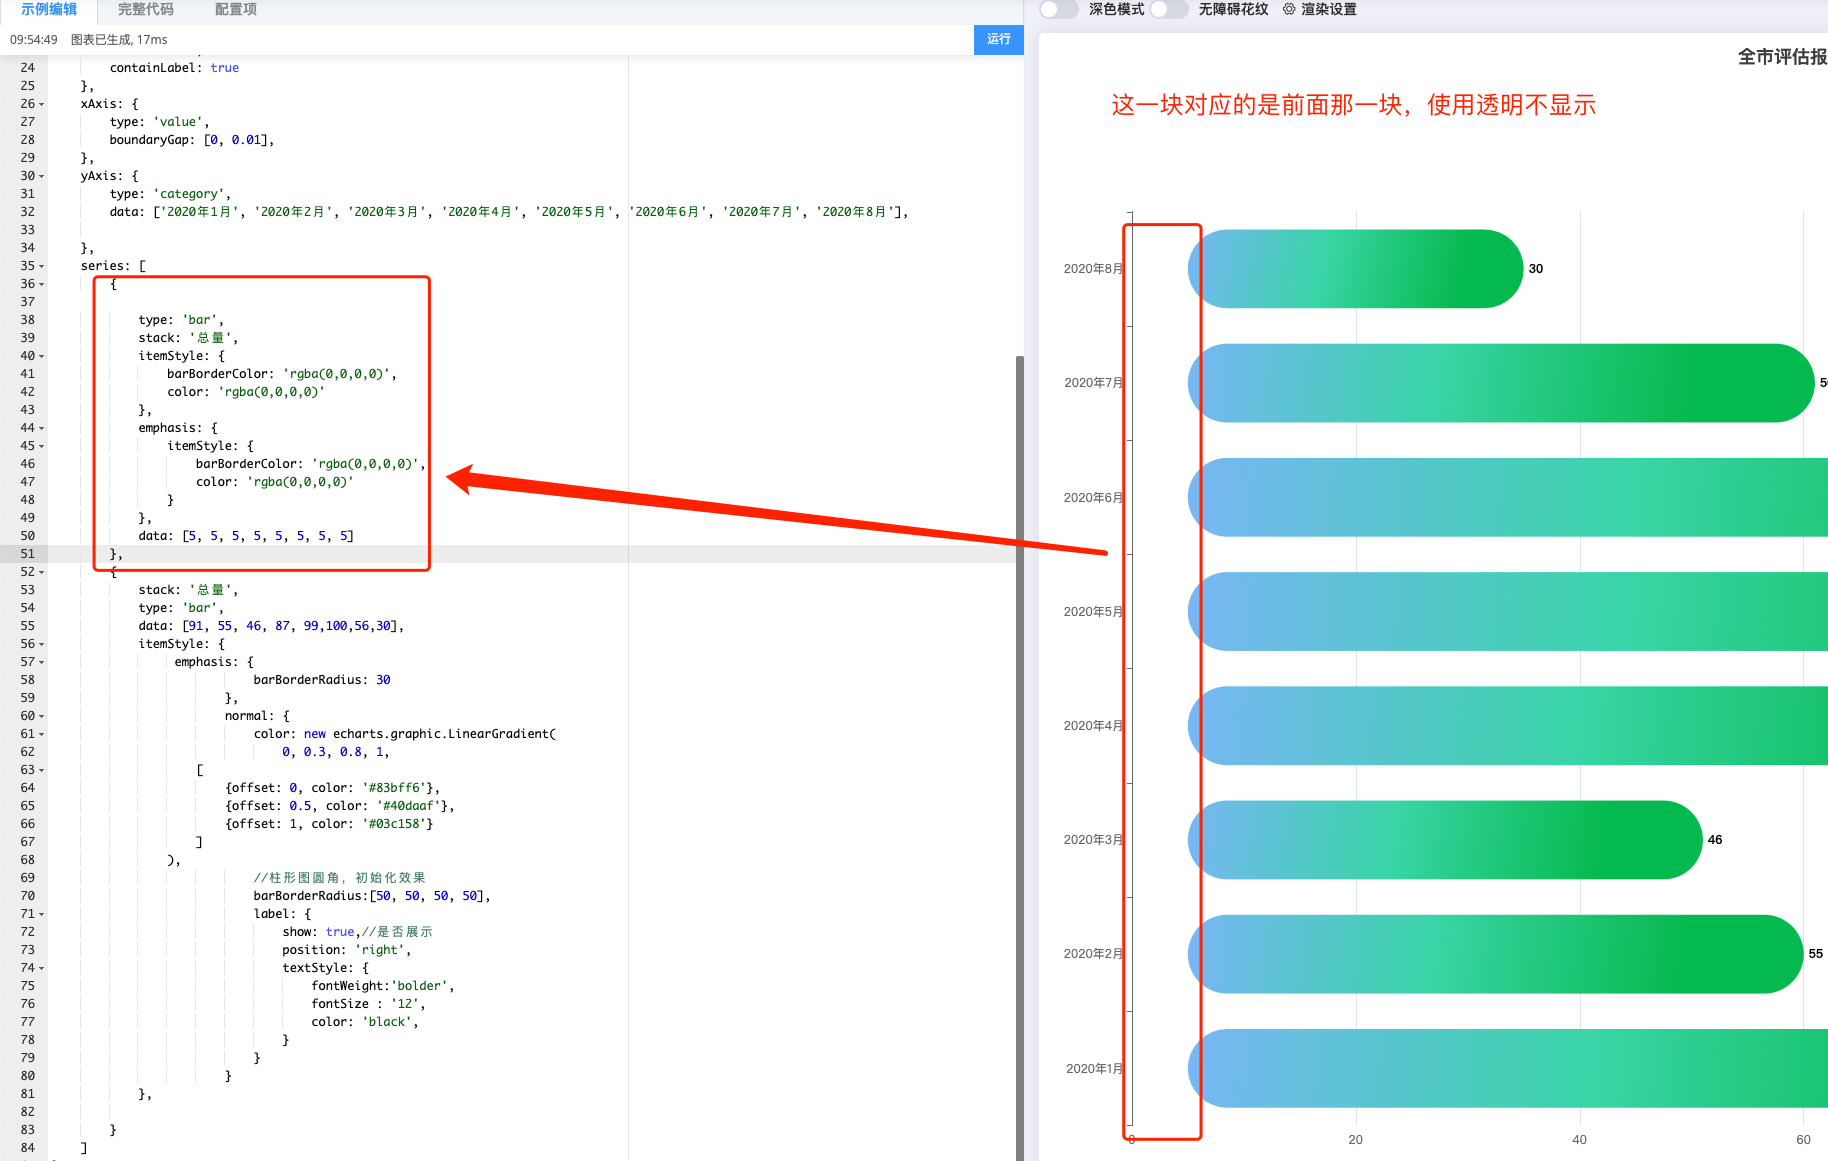
series: [
{
type: 'bar',
stack: '总量',
itemStyle: {
barBorderColor: 'rgba(0,0,0,0)',
color: 'rgba(0,0,0,0)'
},
emphasis: {
itemStyle: {
barBorderColor: 'rgba(0,0,0,0)',
color: 'rgba(0,0,0,0)'
}
},
data: [5, 5, 5, 5, 5, 5, 5, 5]
},
{
stack: '总量',
type: 'bar',
data: [91, 55, 46, 87, 99,100,56,30],
itemStyle: {
emphasis: {
barBorderRadius: 30
},
normal: {
color: new echarts.graphic.LinearGradient(
0, 0.3, 0.8, 1,
[
{offset: 0, color: '#83bff6'},
{offset: 0.5, color: '#40daaf'},
{offset: 1, color: '#03c158'}
]
),
//柱形图圆角,初始化效果
barBorderRadius:[50, 50, 50, 50],
label: {
show: true,//是否展示
position: 'right',
textStyle: {
fontWeight:'bolder',
fontSize : '12',
color: 'black',
}
}
}
},
}
]
};