

87,987
社区成员
 发帖
发帖 与我相关
与我相关 我的任务
我的任务
 分享
分享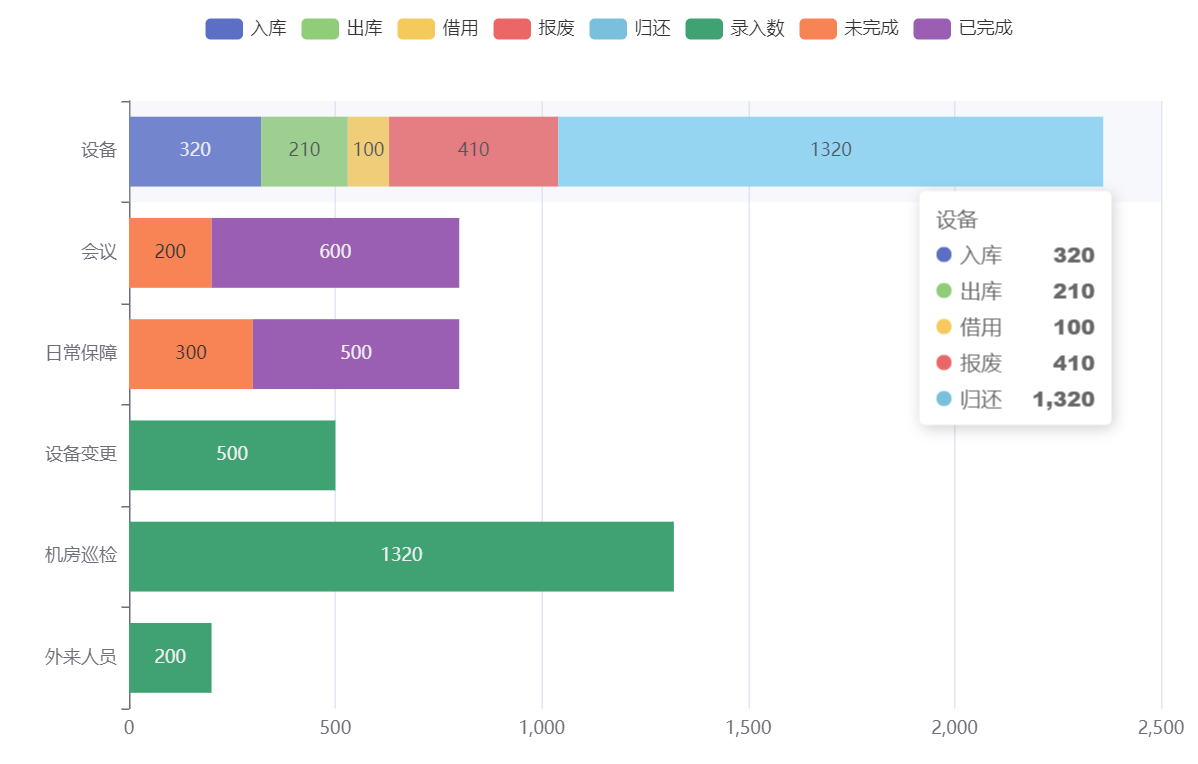
准备用柱状图来统计数量。然后这一步都挺正常的,设备就入库出库等选项。
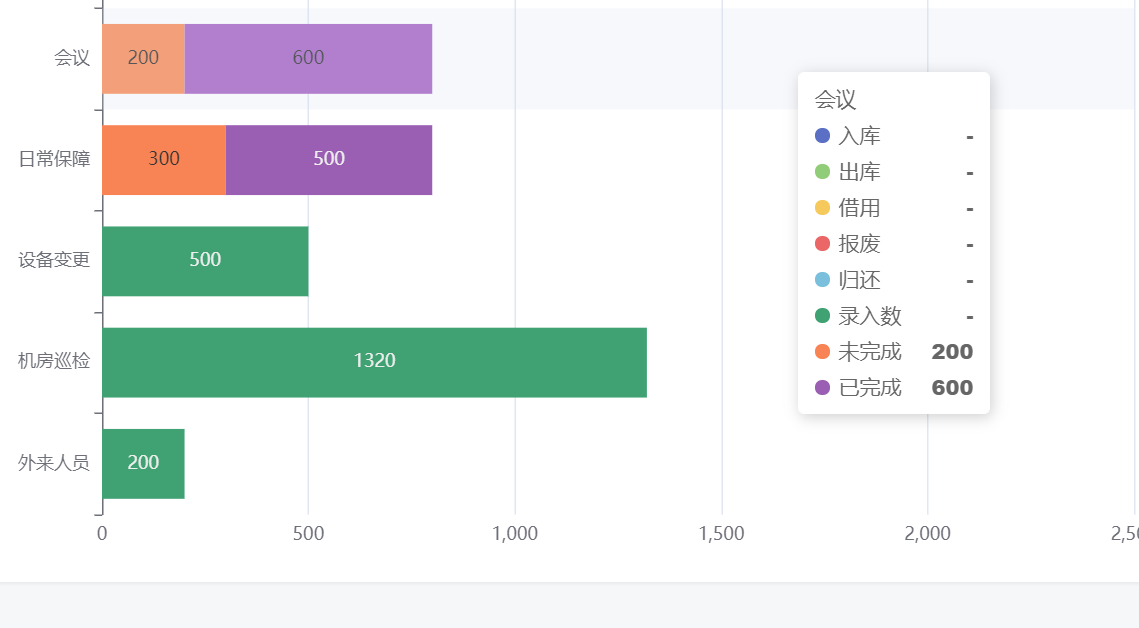
到下面的柱状图,就把上面的入库等选项给包含进去了。。。我想问问有没有什么办法,把下面柱状图的无关选项给去掉。
这段代码如下:
var chartDom = document.getElementById('EchartZhu');
	var myChart = echarts.init(chartDom);
	var option;

	option = {
	  tooltip: {
	    trigger: 'axis',
	    axisPointer: {
	      // Use axis to trigger tooltip
	      type: 'shadow' // 'shadow' as default; can also be 'line' or 'shadow'
	    }
	  },
	  legend: {},
	  grid: {
	    left: '3%',
	    right: '4%',
	    bottom: '3%',
	    containLabel: true
	  },
	  xAxis: {
	    type: 'value'
	  },
	  yAxis: {
	    type: 'category',
	    data: ['外来人员', '机房巡检', '设备变更', '日常保障', '会议', '设备']
	  },
	  series: [
	    {
	      name: '入库',
	      type: 'bar',
	      stack: 'total',
	      label: {
	        show: true
	      },
	      emphasis: {
	        focus: 'series'
	      },
	      data: [,,,,,320]
	    },
	    {
	      name: '出库',
	      type: 'bar',
	      stack: 'total',
	      label: {
	        show: true
	      },
	      emphasis: {
	        focus: 'series'
	      },
	      data: [, , , , , 210]
	    },
	    {
	      name: '借用',
	      type: 'bar',
	      stack: 'total',
	      label: {
	        show: true
	      },
	      emphasis: {
	        focus: 'series'
	      },
	      data: [, , , , , 100]
	    },
	    {
	      name: '报废',
	      type: 'bar',
	      stack: 'total',
	      label: {
	        show: true
	      },
	      emphasis: {
	        focus: 'series'
	      },
	      data: [, , , , , 410]
	    },
	    {
	      name: '归还',
	      type: 'bar',
	      stack: 'total',
	      label: {
	        show: true
	      },
	      emphasis: {
	        focus: 'series'
	      },
	      data: [, , , , , 1320]
	    },
	    {
	      name: '录入数',
	      type: 'bar',
	      stack: 'total',
	      label: {
	        show: true
	      },
	      emphasis: {
	        focus: 'series'
	      },
	      data: [200,1320 ,500 ,,, ]
	    },
	    {
	      name: '未完成',
	      type: 'bar',
	      stack: 'total',
	      label: {
	        show: true
	      },
	      emphasis: {
	        focus: 'series'
	      },
	      data: [, , ,300,200, ]
	    },
	    {
	      name: '已完成',
	      type: 'bar',
	      stack: 'total',
	      label: {
	        show: true
	      },
	      emphasis: {
	        focus: 'series'
	      },
	      data: [, , ,500,600, ]
	    }
	  ]
	};

	option && myChart.setOption(option);

搜一下 echarts tooltip formatter自定义


