183
社区成员
 发帖
发帖 与我相关
与我相关 我的任务
我的任务
 分享
分享| The Link Your Class | https://bbs.csdn.net/forums/MUEE308FZ?category=0 |
|---|---|
| The Link of Requirement of This Assignment | https://bbs.csdn.net/topics/603386400 |
| MU STU ID and FZU STU ID | 19105151 831901204 |
Requirement
Please issue your Lab Blog on CSDN.
The Link of your blog of this lab and This Lab Sheet (This word file) must be submitted to Moodle, or you will lose the score of this Lab. (VERY IMPORTANT: You should submit TWO things)
Modeling must use professional tools.
You should EXPLAIN your diagrams in words if necessary.
Question
Live-streaming sale, through some Internet platforms, is a new way of service using live-streaming technology for close commodity display, consultation response, and shopping guide. Merchants can open their own live broadcast room, or employ professional anchors to recommend goods. At present, not only many celebrities flock into this field, but some big companies’ executives are also frequently involved. Please try to design a comprehensive live-streaming sale system.
(1)List some actors that interact with this system. Explain the relevance of each actor.
Actor:Professional anchors,such as many celebrities and some big companies’ executives ,who need to supervise the content of merchants' live broadcast to comply with regulations, and also supervise the legality of merchants' goods sold
Actor:Merchants,who apply for livestreaming permission from the administrator and sell items to customers on the livestreaming platform
Actor:Customers,who are watching the live broadcast and buying the goods through the Live-streaming sale system.
(2)Prepare a use case diagram for this system
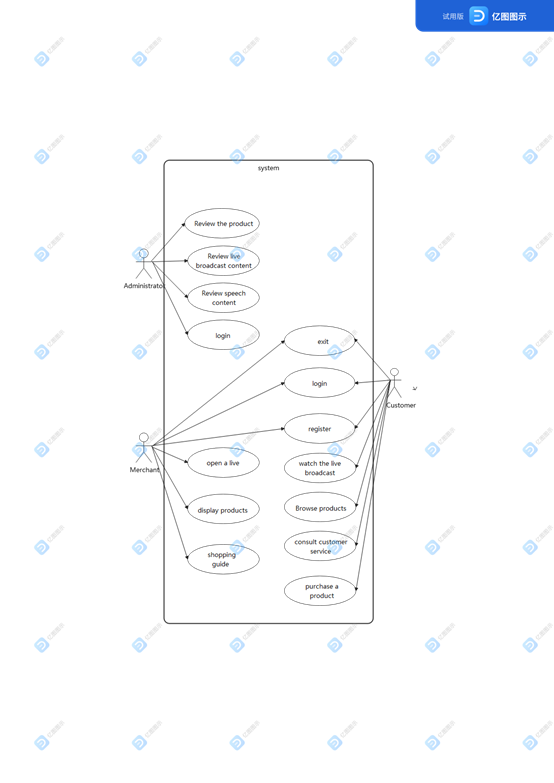
(3) Prepare a normal scenario for each use case. (i.e. describe each use case in words)
Registration: Business administrators and customers need to register their accounts and passwords here for the first time
Login: merchant administrator and customer Login, including account and password;
Exit: The merchant administrator and customer exit;
Watch the live broadcast: Customers Watch live broadcast, including live broadcast links and product links;
Browse Products: Customers view product information, including prices, live links and store information;
Consolt Customer Service: Ask for store information;
Purchase a product: The Purchase of a product, including customer balance, product information;
Open a live: Enables live streaming, including live links;
Display products: show the information of products , including price and so on;
Shopping guide: talk with customer;
Review the product: check the products if it is pass the requirements, including price , product type an so on;
Review speech content: check the Living information, including the speech and frames
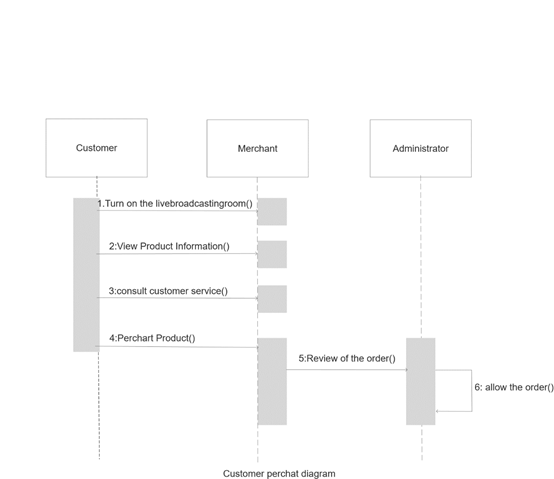
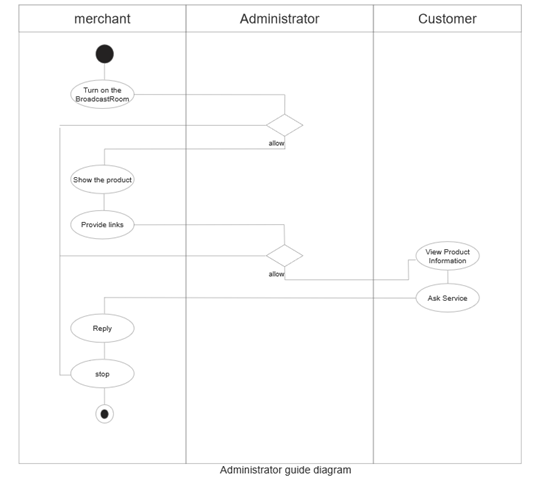
(4) Prepare sequence diagrams or activity diagrams for primary scenarios. By the way, each scenario can be described by a sequence diagram or an activity diagram, but both diagrams must be used in this question.
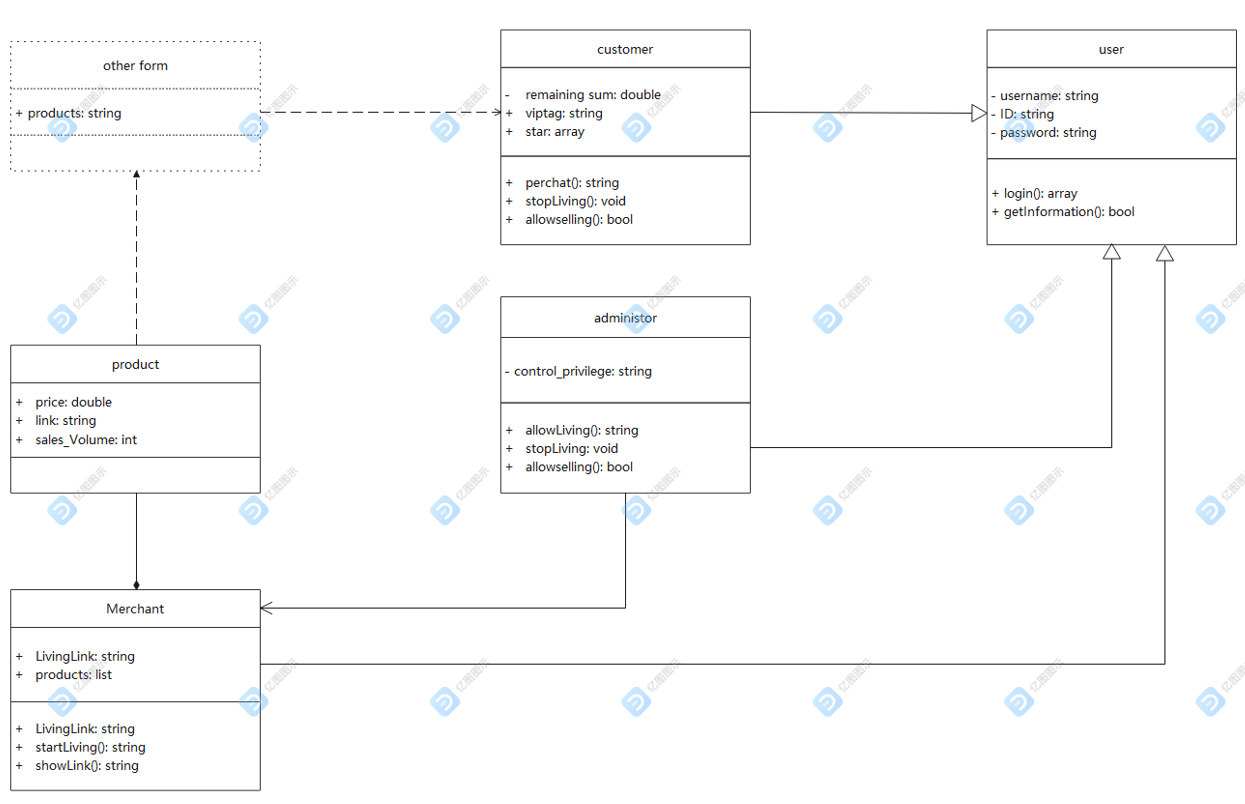
(5) Prepare a class diagram for this system. Explain which principles of object-oriented are applied in your design.
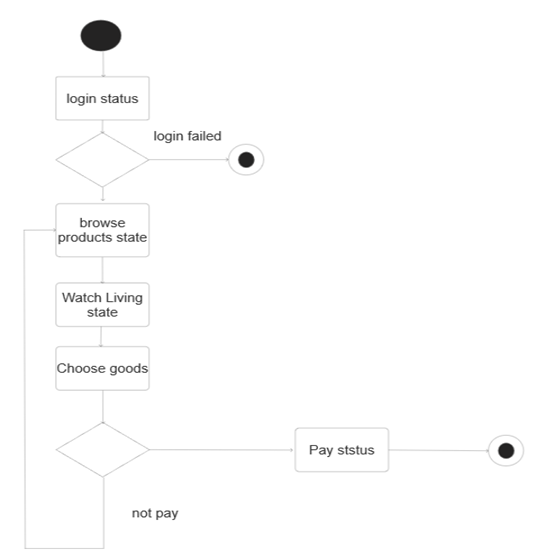
(6) Prepare state diagrams for primary classes.
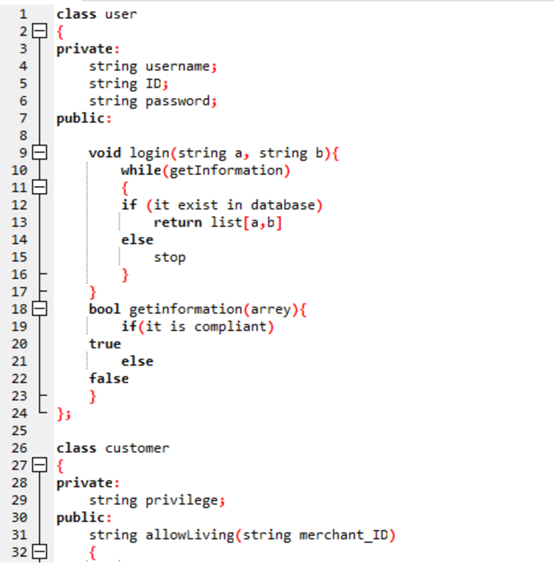
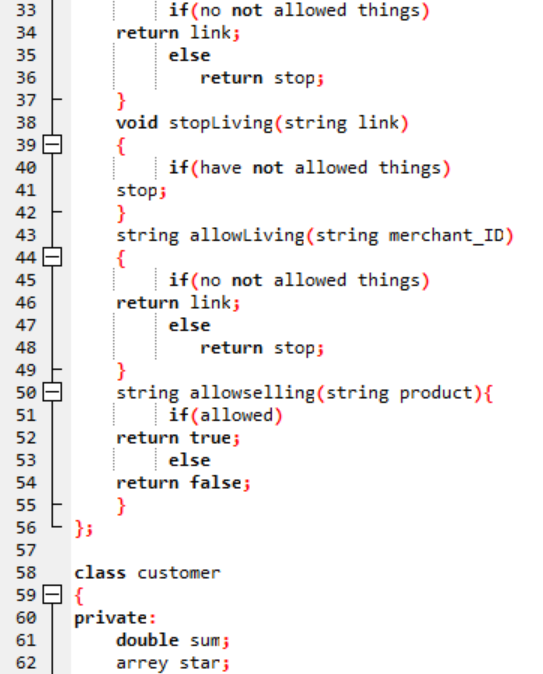
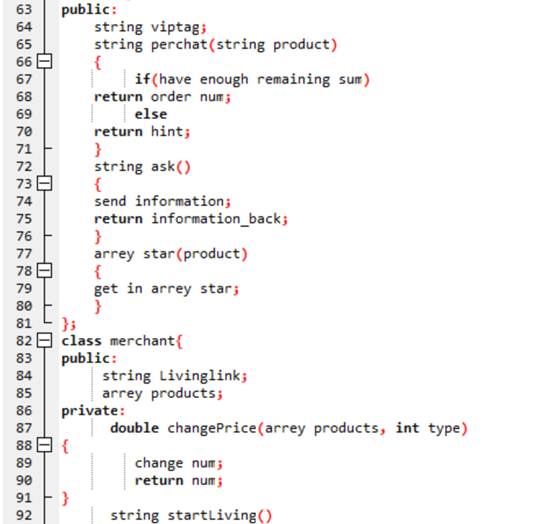
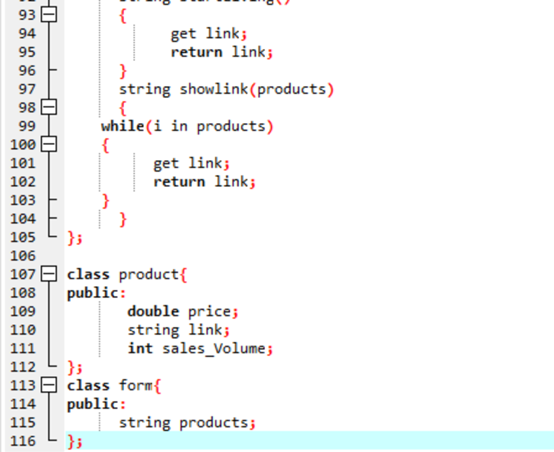
(7) Write the skeleton code corresponding to the class diagram in C++, Java, Python, or C#.