


1,940
社区成员
 发帖
发帖 与我相关
与我相关 我的任务
我的任务
 分享
分享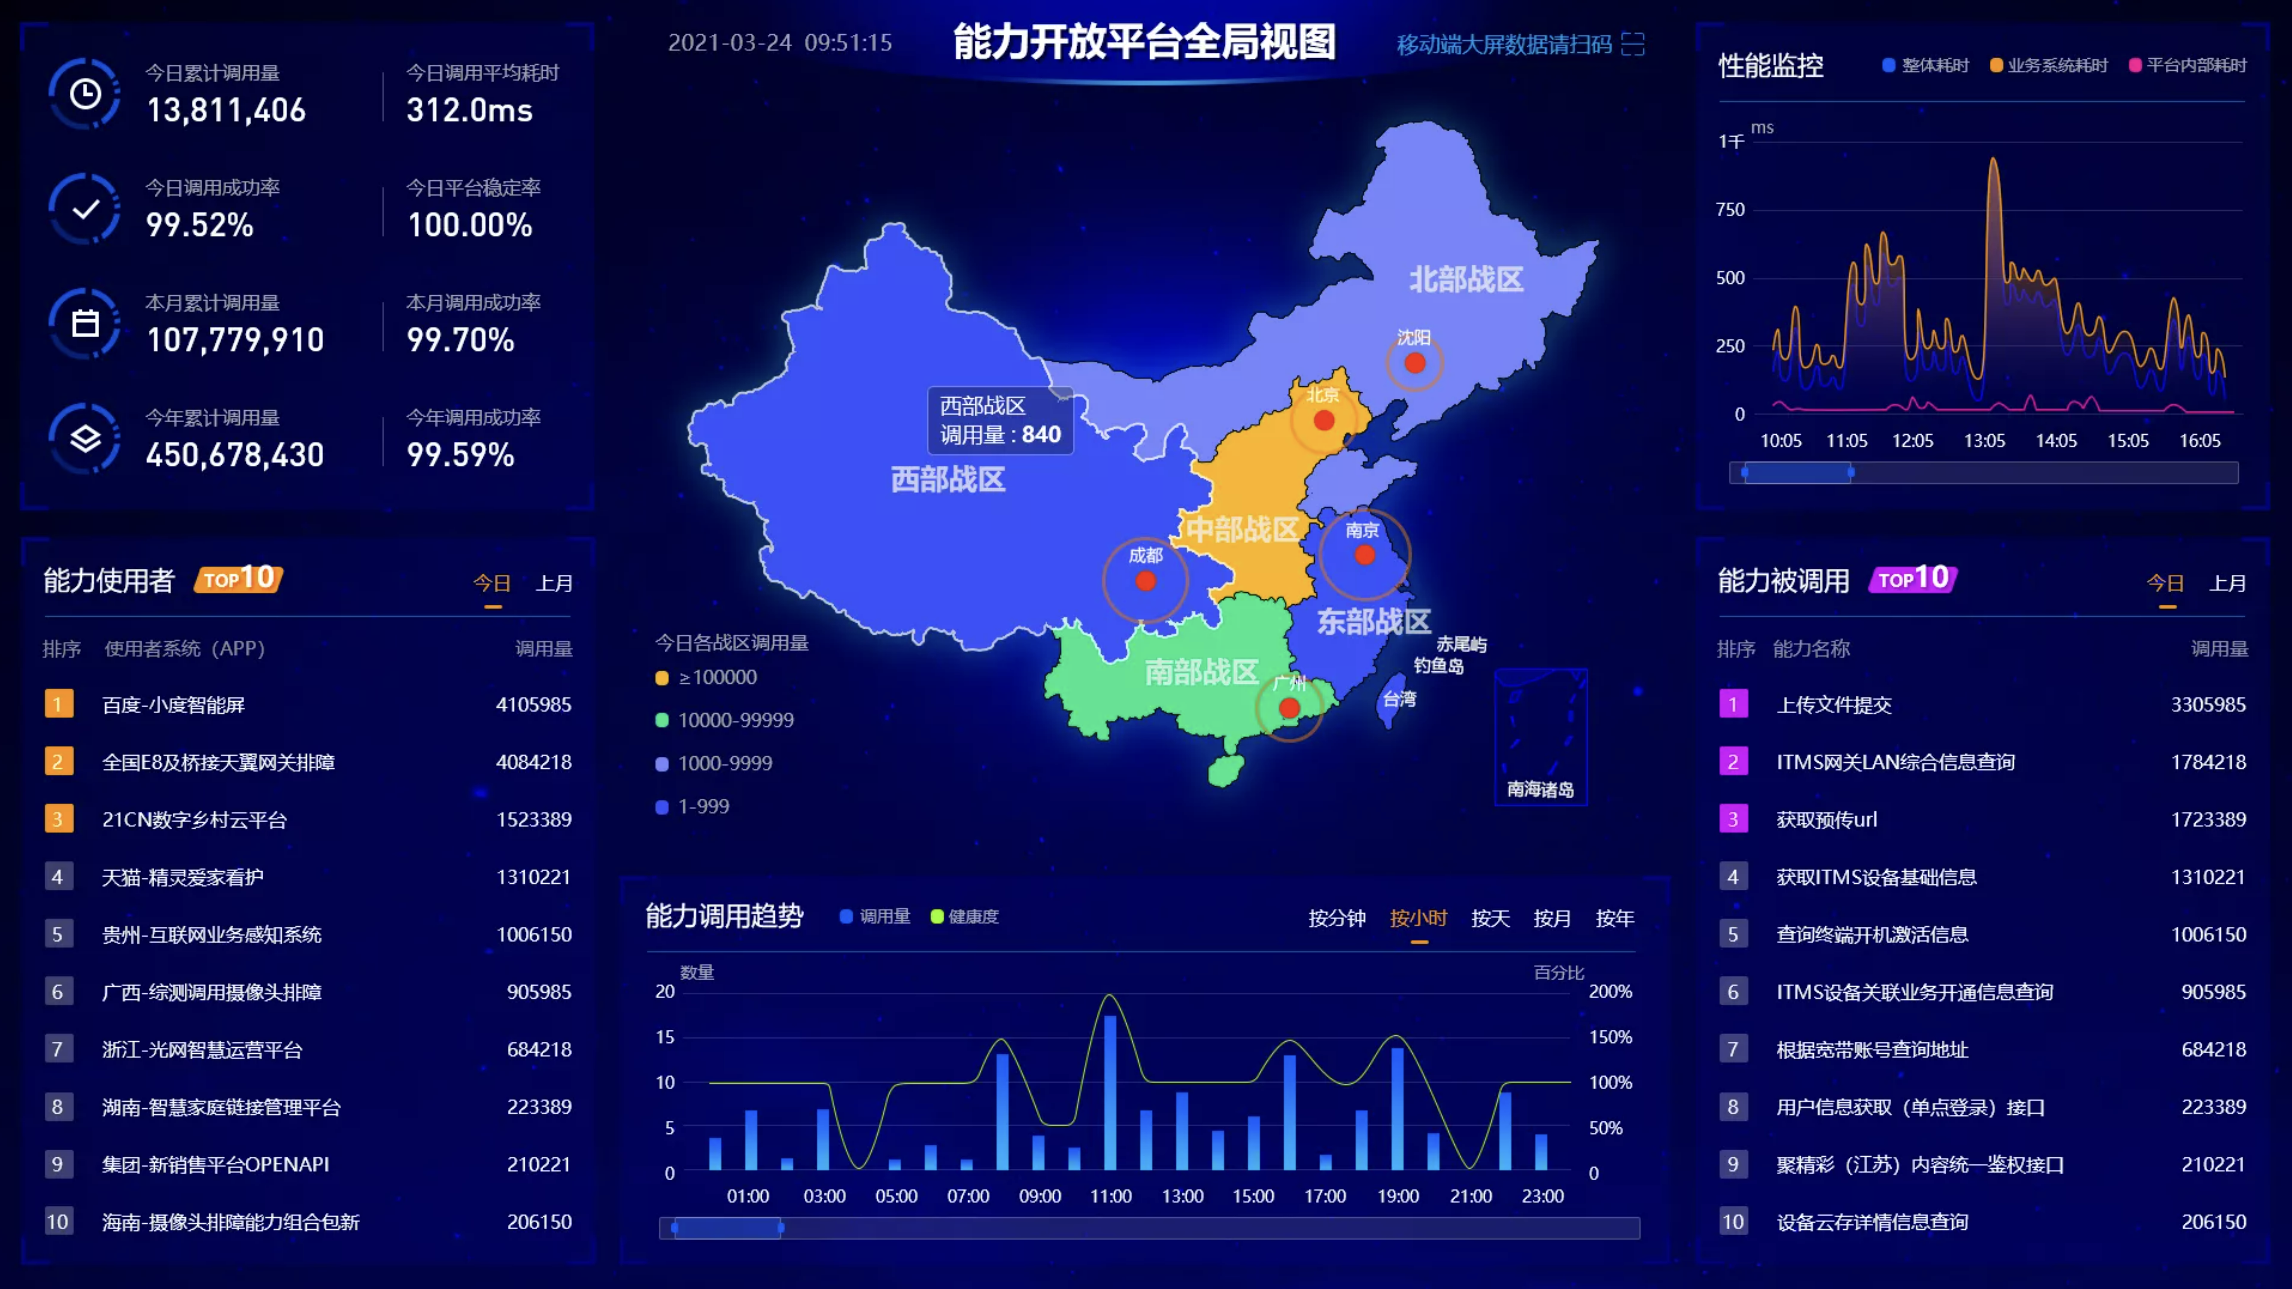
    /**
     * 渲染战区地图
     */
    drawLine(regionList){
      let charts = this.$echarts.init(document.querySelector(`#myChart`));
      charts.setOption({
        title: {
          text: "",
          subtext: "",
          x: "center",
            textStyle:{
                color:'#fff'
            },
        },
        tooltip: {
          trigger: "item"
        },
        //左侧小导航图标
        visualMap: {
            bottom:'10%',
            type: 'piecewise',
            splitNumber:5,
            max: 50000,
            text:['今日各战区调用量'],
            showLabel: true,
            pieces: [
                {min:10000, max: 99999999,color:'#FFB400 ',label:`>=100000`},
                {min: 10000, max: 99999,color:'#04E58B',label:`10000-99999`},
                {min: 1000, max: 9999,color:'#7486FF',label:`1000-9999`},
                {min: 1, max: 999,color:'#3752FD',label:`1-999`},
            ],
            textStyle:{
                color:'rgb(135,139,153)',
                fontSize:this.FontChart(1.5)
            },
            seriesIndex: 0,
        },
        series: [
          {
            name: "调用量",
            type: "map",
            mapType: "china",
            roam: false,
            label: {
                axisLabel:{
                    color:'#fff'
                },
              normal: {
                show: true,
                textStyle: {
                    color: "#fff"
                }
              },
              emphasis: {
                show: true
              }
            },
            data: regionList
          },
          {
            type: 'effectScatter',
            coordinateSystem: 'geo',
            roam: false,
            color: '#FF2400',
            data: [
              { name: '成都', value: [104.076195, 30.718679] },
              { name: '广州', value: [113.26453, 23.139058] },
              { name: '北京', value: [116.394415, 39.925091] },
              { name: '南京', value: [118.805871, 32.086192] },
              { name: '沈阳', value: [123.465921, 41.693311] }
            ],
            showEffectOn: "render",
            rippleEffect: {
              brushType: "stroke",
              color: "#FF7200 ",
              period: 9,
              scale: 15
            },
            symbolSize: 6,
            label: {
              formatter: "{b}",
              position: "right",
              show: true,
              normal: {
                show: true,
                formatter: (data) => {
                  return data.name
                },
                textStyle: {
                  color: '#fff',
                },
              },
            },
          },
          {
            type: 'scatter',
            coordinateSystem: 'geo',
            roam: false,
            color: '#FF2400',
            data: [
              { name: '台湾', value: [121.520076, 25.030724] },
              { name: '钓鱼岛', value: [123.284, 25.446] },
              { name: '赤尾屿', value: [124.3409, 25.5354] },
            ],
            showEffectOn: "render",
            rippleEffect: {
              brushType: "stroke",
              color: "#FF7200 ",
              period: 9,
              scale: 15
            },
            symbolSize: 6,
            label: {
              normal: {
                show: true,
                formatter: (data) => {
                  if (data.name == '台湾') {
                    return `{taiwan|${data.name}}`
                  }
                  if (data.name == '钓鱼岛') {
                    return `{diaoYu|${data.name}}`
                  }
                  if (data.name == '赤尾屿') {
                    return `{chiWei|${data.name}}`
                  }
                  return data.name
                },
                textStyle: {
                  color: '#fff',
                  fontSize:this.FontChart(1)
                },
                rich: {
                  taiwan: {
                    padding: [20, 20, 0, 0]
                  },
                  diaoYu: {
                    padding: [0, 0, 0, 0]
                  },
                  chiWei: {
                    padding: [0, 0, 20, 0]
                  }
                }
              }
            }
          }
        ],
          geo: {
            map: 'china'
          }
      })

      window.addEventListener("resize", function() {
        charts.resize()
      })
      }
    }

data中的数据是什么

大佬,求教程
方便分享下战区的json数据嘛?

