37,976
社区成员
 发帖
发帖 与我相关
与我相关 我的任务
我的任务
 分享
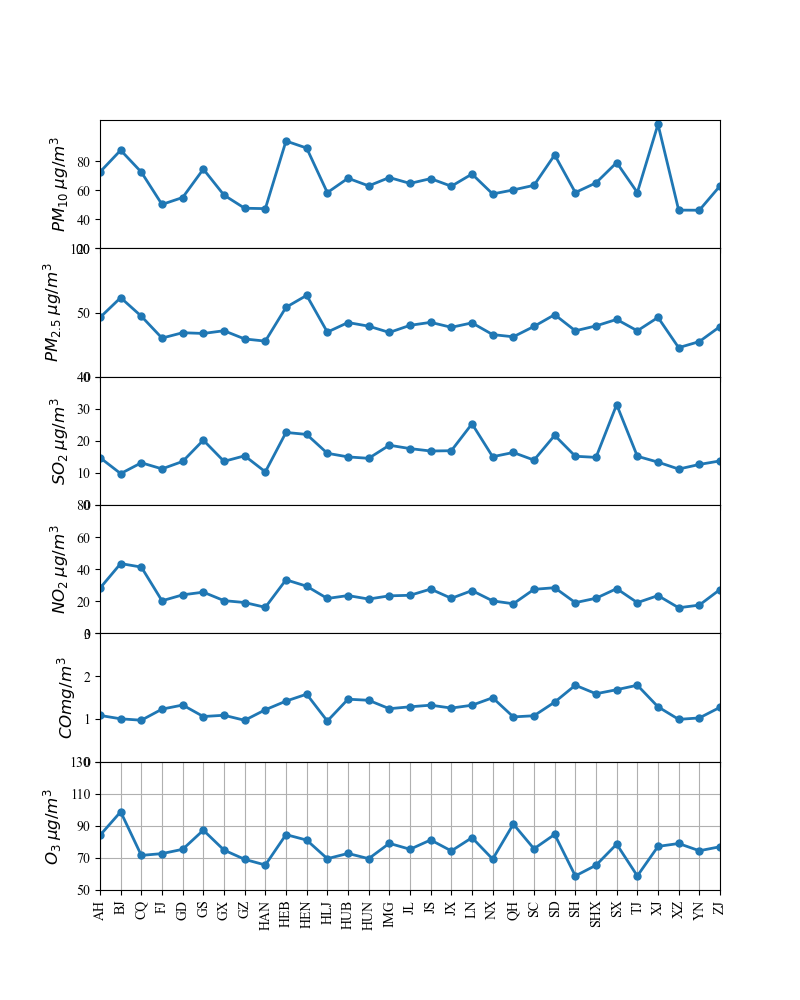
分享matplotlib绘图,遇到问题,网格总是显示不全,大佬给改改代码。想要全部显示网格,现在只有ax6显示,英文横坐标是文本,不知道ax.ser_xticks()怎么设置。
fig, (ax1, ax2, ax3, ax4, ax5, ax6) = plt.subplots(6, 1, sharex = 'all',
                                                   figsize =(8, 10))
fig.subplots_adjust(hspace=0)
plt.autoscale(enable=True, axis='both', tight=True)

ax1.plot(df04['pro'], df04['PM10'], ls = '-', lw = 2, marker = 'o',
         markersize = 5)
ax1.set_yticks(np.arange(20, 100, 20))
ax1.set_ylim(auto= True)
ax1.set_ylabel(r'$PM_{10}$ $\mu$$g/m^{3}$', fontsize = 12)
plt.grid(True, axis='both')

ax2.plot(df04['pro'], df04['PM25'], ls = '-', lw = 2, marker = 'o', markersize = 5)
ax2.set_yticks(np.arange(0, 150, 50))
ax2.set_ylim(auto= True)
ax2.set_ylabel(r'$PM_{2.5}$ $\mu$$g/m^{3}$', fontsize = 12)
plt.grid(True, axis='both')

ax3.plot(df04['pro'], df04['SO2'], ls = '-', lw = 2, marker = 'o', markersize = 5)
ax3.set_yticks(np.arange(0, 50, 10))
ax3.set_ylim(auto= True)
ax3.set_ylabel(r'$SO_{2}$ $\mu$$g/m^{3}$', fontsize = 12)
plt.grid(True, axis='both')

ax4.plot(df04['pro'], df04['NO2'], ls = '-', lw = 2, marker = 'o', markersize = 5)
ax4.set_yticks(np.arange(0, 100, 20))
ax4.set_ylim(auto= True)
ax4.set_ylabel(r'$NO_{2}$ $\mu$$g/m^{3}$', fontsize = 12)
plt.grid(True, axis='both')

ax5.plot(df04['pro'], df04['CO'], ls = '-', lw = 2, marker = 'o', markersize = 5)
ax5.set_yticks(np.arange(0, 4, 1))
ax5.set_ylim(auto= True)
ax5.set_ylabel(r'$CO m$$g/m^{3}$', fontsize = 12)
plt.grid(True, axis='both')

ax6.plot(df04['pro'], df04['O3'], ls = '-', lw = 2, marker = 'o', markersize = 5)
ax6.set_yticks(np.arange(50, 150, 20))
ax6.set_ylim(auto= True)
ax6.set_ylabel(r'$O_{3}$ $\mu$$g/m^{3}$', fontsize = 12)
ax6.set_xticklabels(df04['pro'], rotation=90)
plt.grid(True, axis='both')

plt.show()